Shape Regression User Tutorial
Authors: James Fishbaugh, Guido Gerig, Laura Pascal, Jared Vicory, Beatriz Paniagua
Collaborators:


Outline
1) Description of Shape Regression
2) Installing the Software
3) Shape Regression Workflow
4) Debugging and Quality Control
5) Acknowledgments and Resources
Description of Shape Regression

Shape regression consists of estimating a continuous shape sequence which best matches a set of observed shapes. We use a growth model that represents anatomical evolution by a continuous deformation of space.
This was done before by Thomas D’Arcy Thompson.

Acceleration Controlled Shape Regression
Deformations are parameterized by a flow of deformations by acceleration vectors, which produce velocity, which in turn results in a change of position.
We define the acceleration field $a(x(t))$
Where $x_i$ is the shape points carrying a point force vector $\alpha_i$
Where $K(x,y)$ is a kernel with standard deviation $\lambda_V$

The time varying deformation $\phi_t(x_i)$ is given by the equation below, with initial position $x_i(0)$ and initial velocity $\dot{x}_i(0)$
Impact of Parameters
Size of deformation kernel: The distance at which neighboring points move in correlation. Higher values result in mostly rigid deformation, while lower values allow points a greater degree of independent movement.
Size of shape matching kernel: The scale at which shape differences are considered noise. For matching very detailed shape features, choose a small value. For noisy observations with spurious features, set this value larger than the size of the features.
Regularity weight: A low weight on regularity results in models which closely match observed data, tending towards interpolation (rather than regression) the weight goes to zero.
See “Model selection for spatiotemporal modeling of early childhood sub-cortical development” SPIE Medical Imaging (2019) for more detail
Installing the Software
Installation of ShapeRegression Module through SlicerSALT
Download the SlicerSALT packages for your respective operating system from the SlicerSALT website and install it.

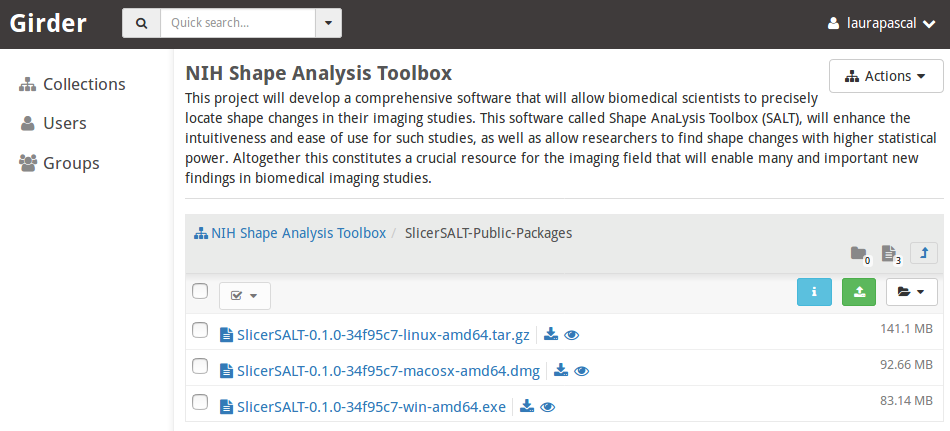
Installation of ShapeRegression Module through 3D Slicer
In 3D Slicer, open the Extension Manager

Installation of ShapeRegression Module In 3D Slicer
In the Install Extension tab, select Shape Regression under Categories
Under ShapeRegressionExtension , select the Install button and restart Slicer when prompted

Shape Regression Workflow
1) Regression Computation – Model estimation
2) Regression Visualization – Visualization of estimated shape change
Shape Regression Model Estimation
After installing, begin by selecting ‘ Regression Computation ’

Then download sample data to a directory of your choice

Click the button to select the directory with input vtk shapes
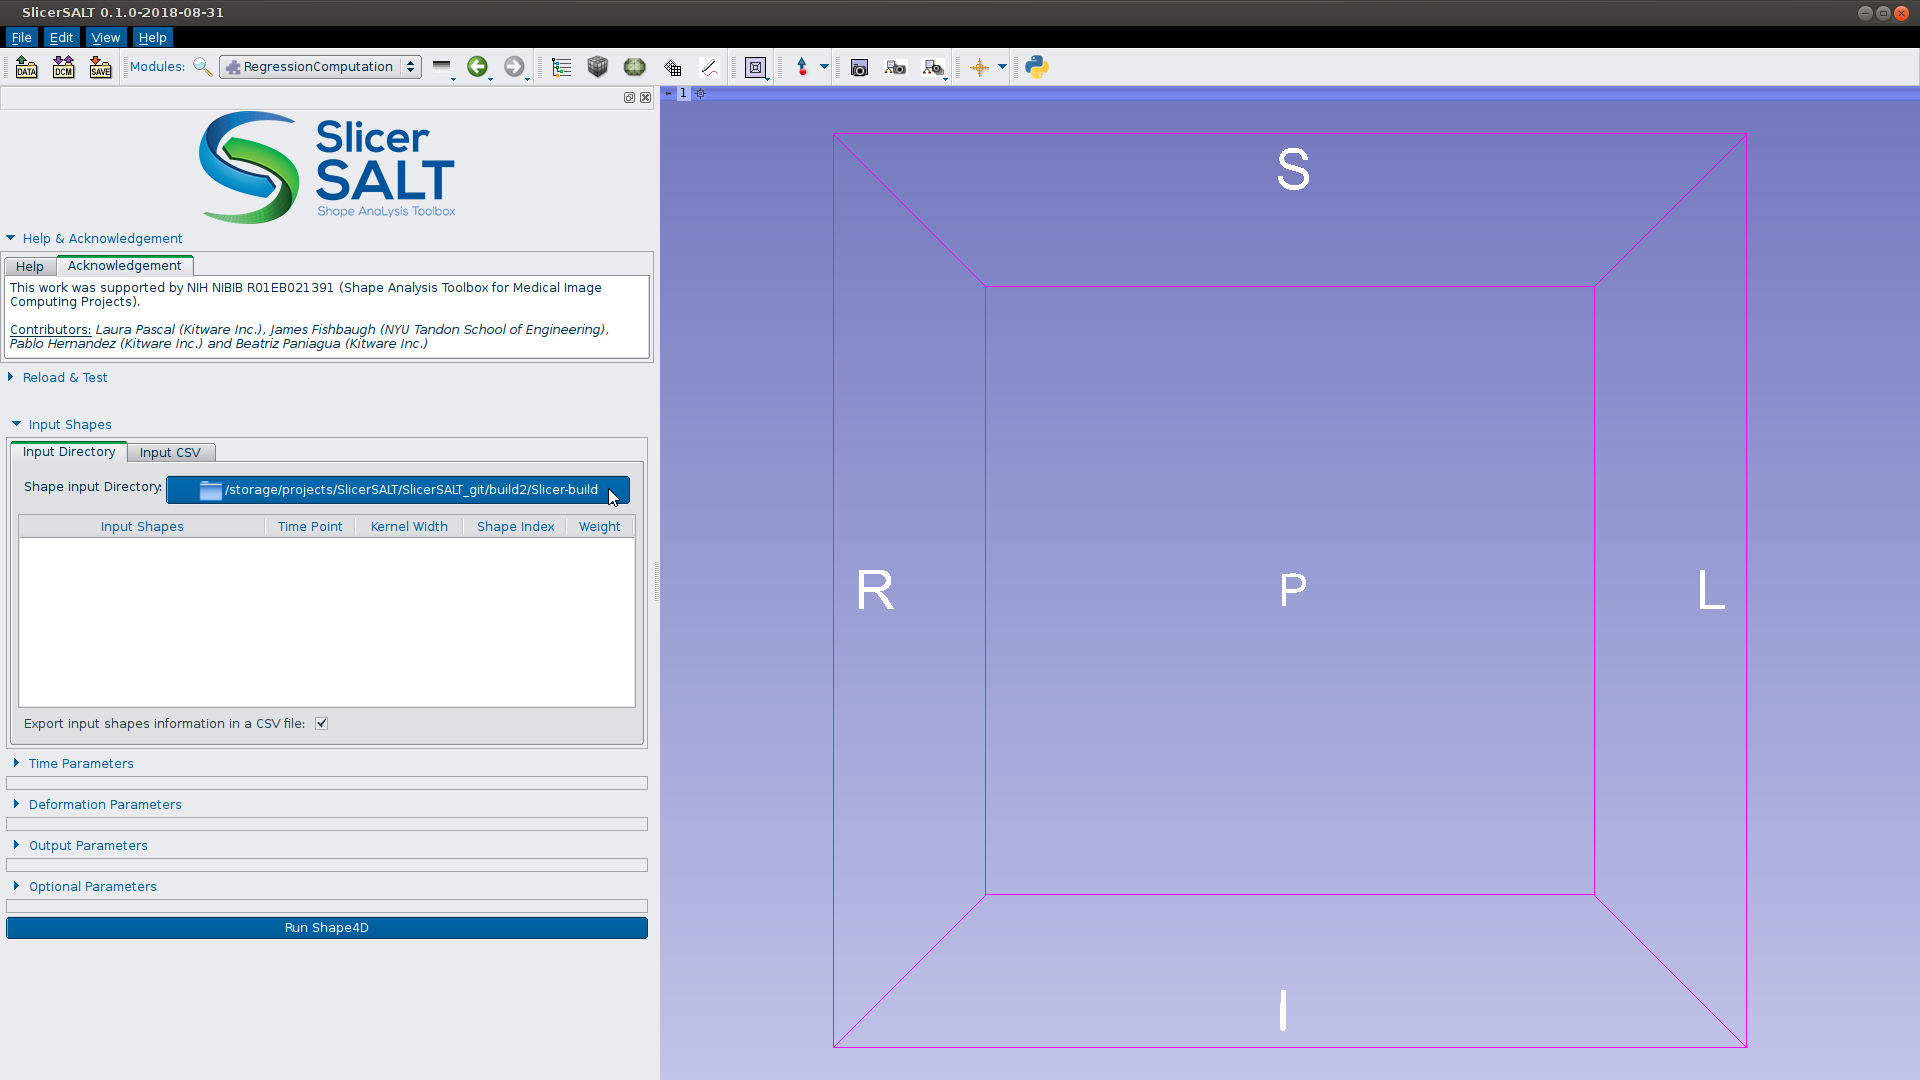
Navigate to the directory containing the tutorial shapes

Setting Parameters
Time point automatically populated if shape names have time-suffix

Kernel width initialized as 50% of the smallest extent of the shape

Shape index indicates shape correspondence in multi-objects
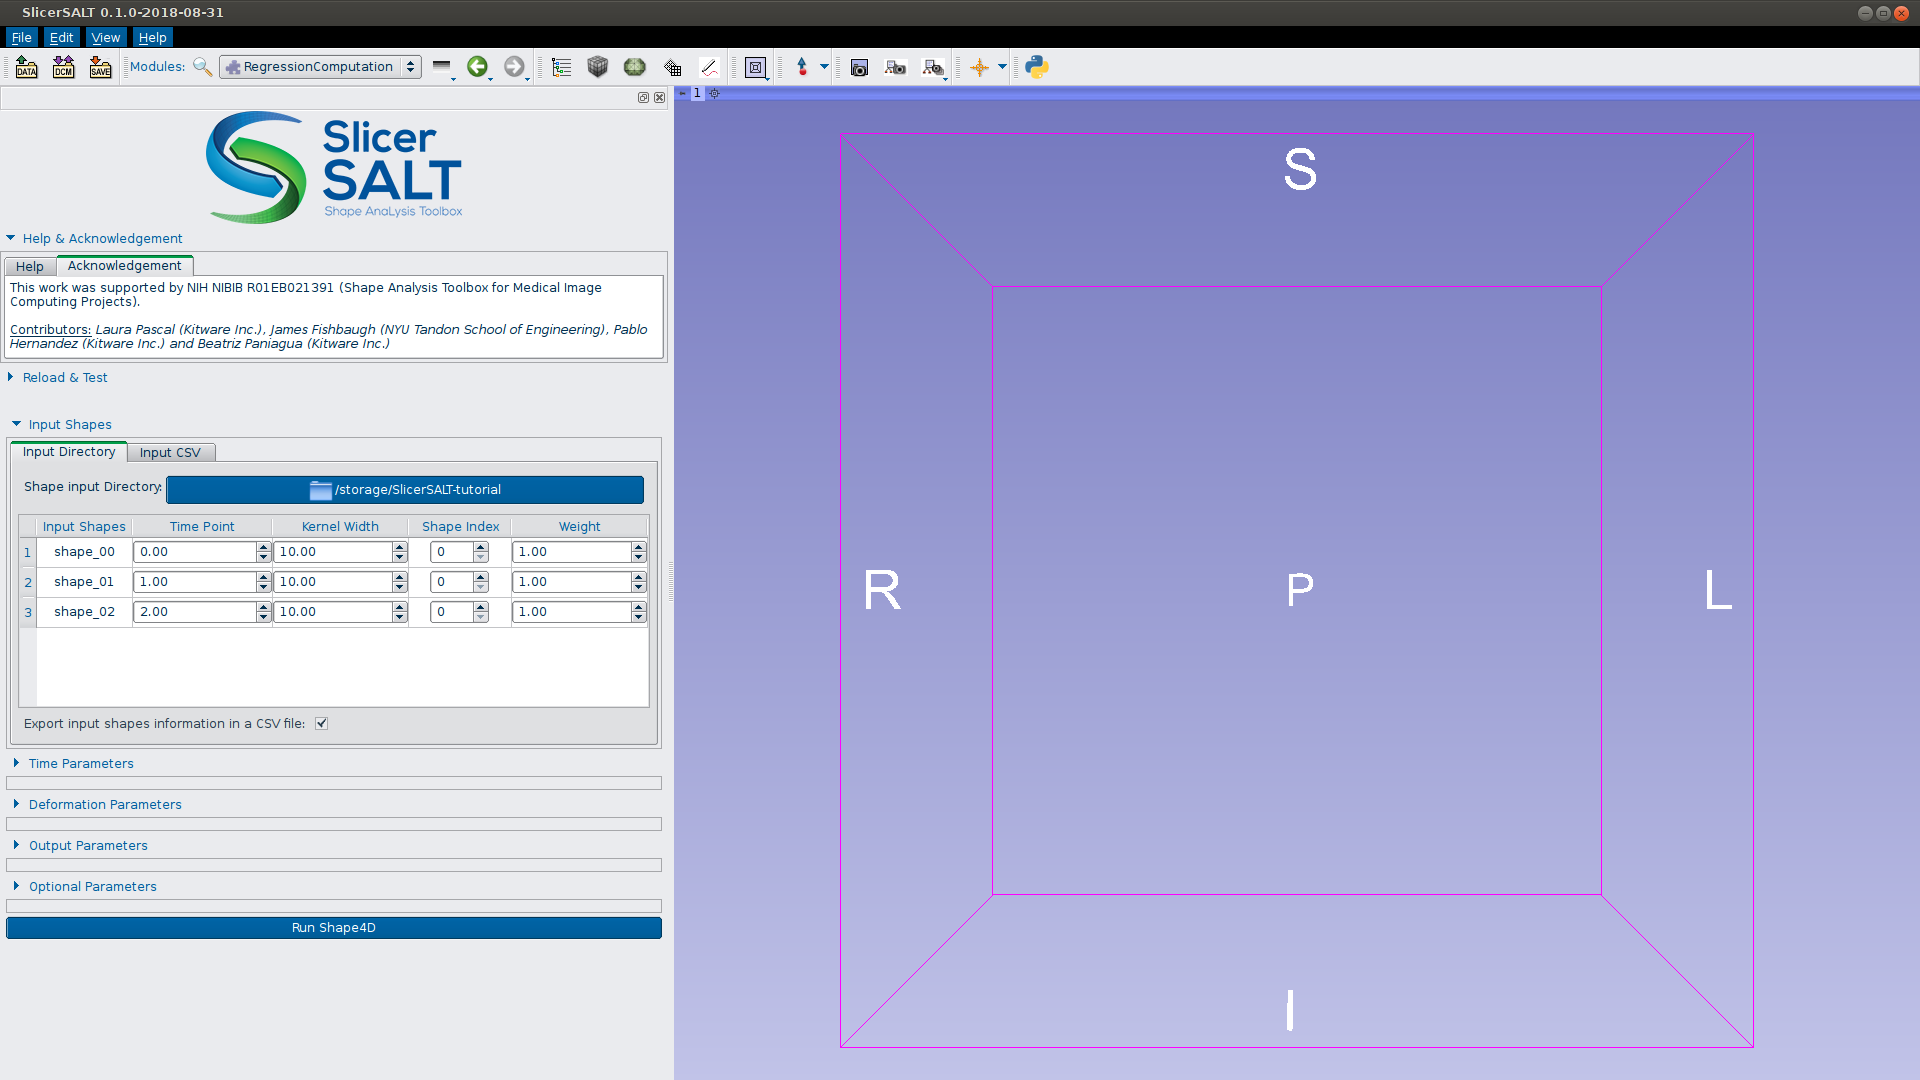
Weight controls the importance of each shape in model estimation
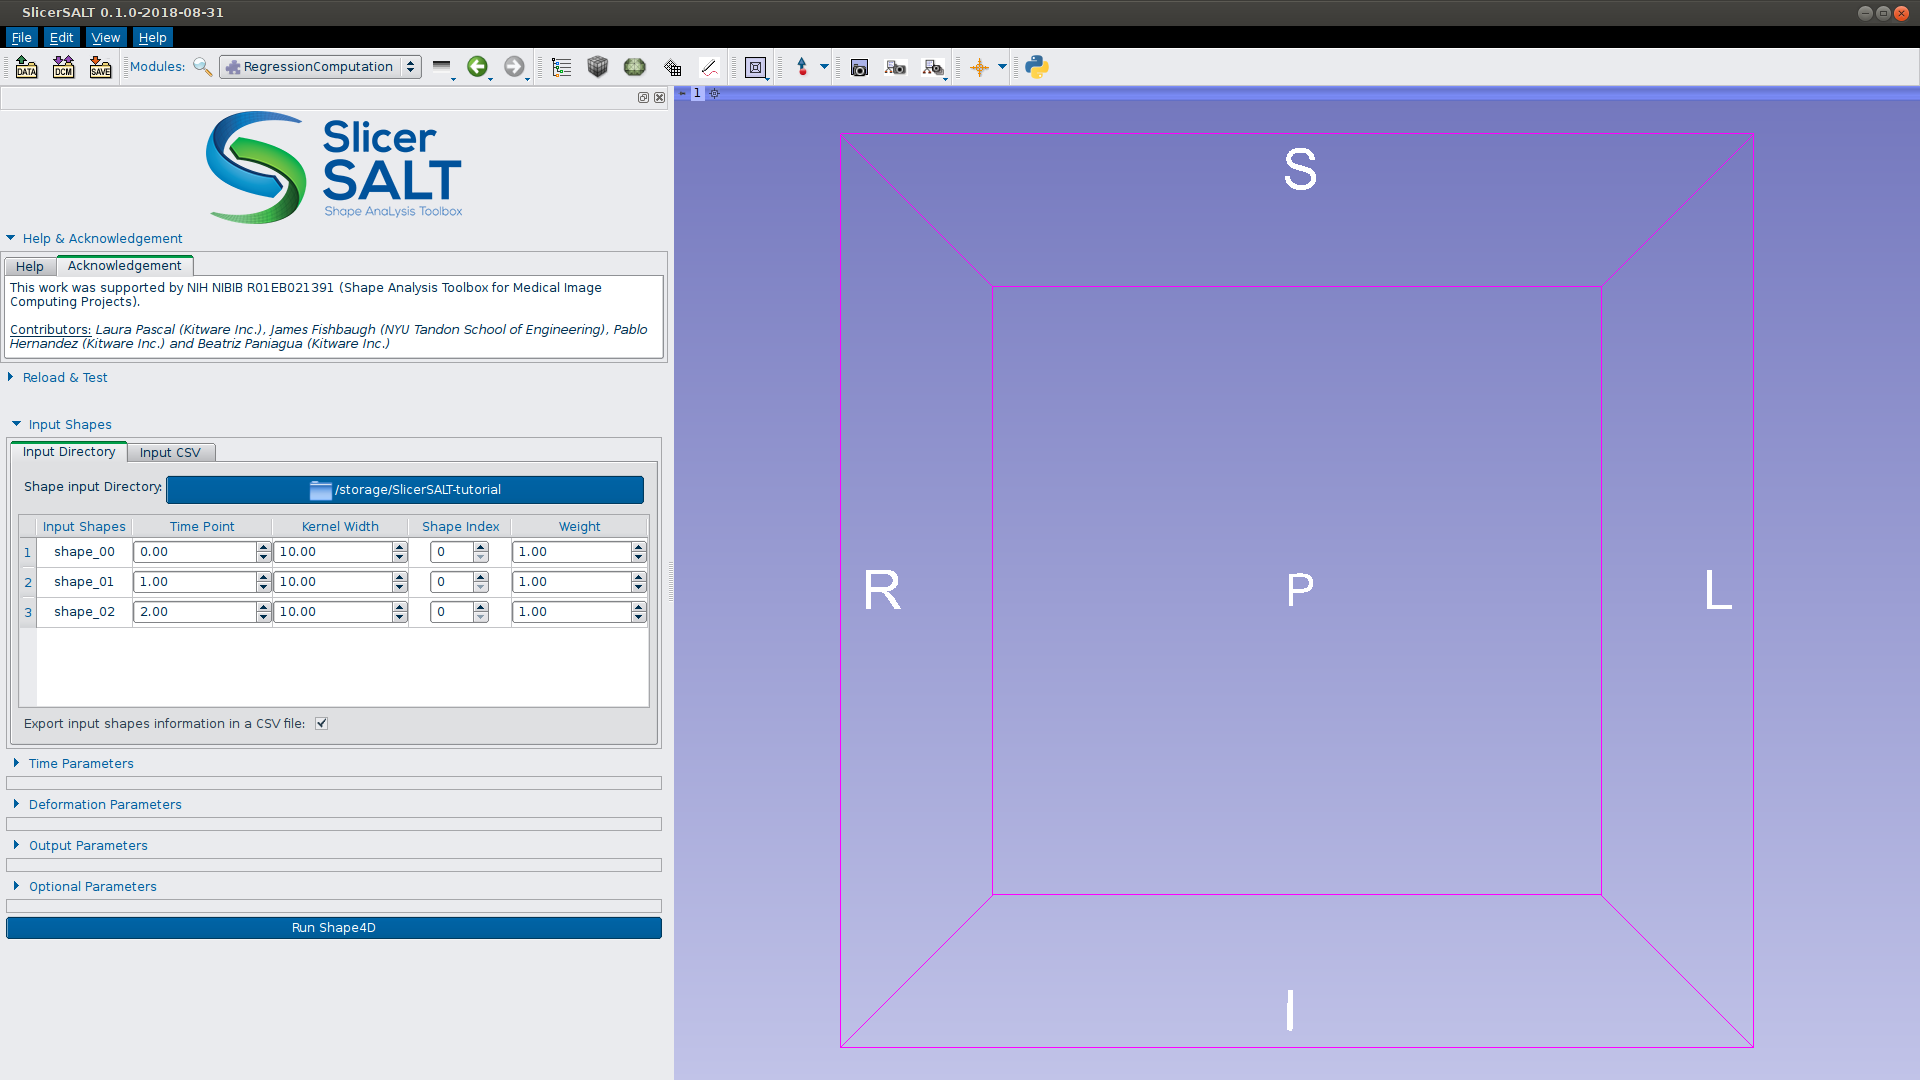
Leave all settings at default and expand ‘Time Parameters’
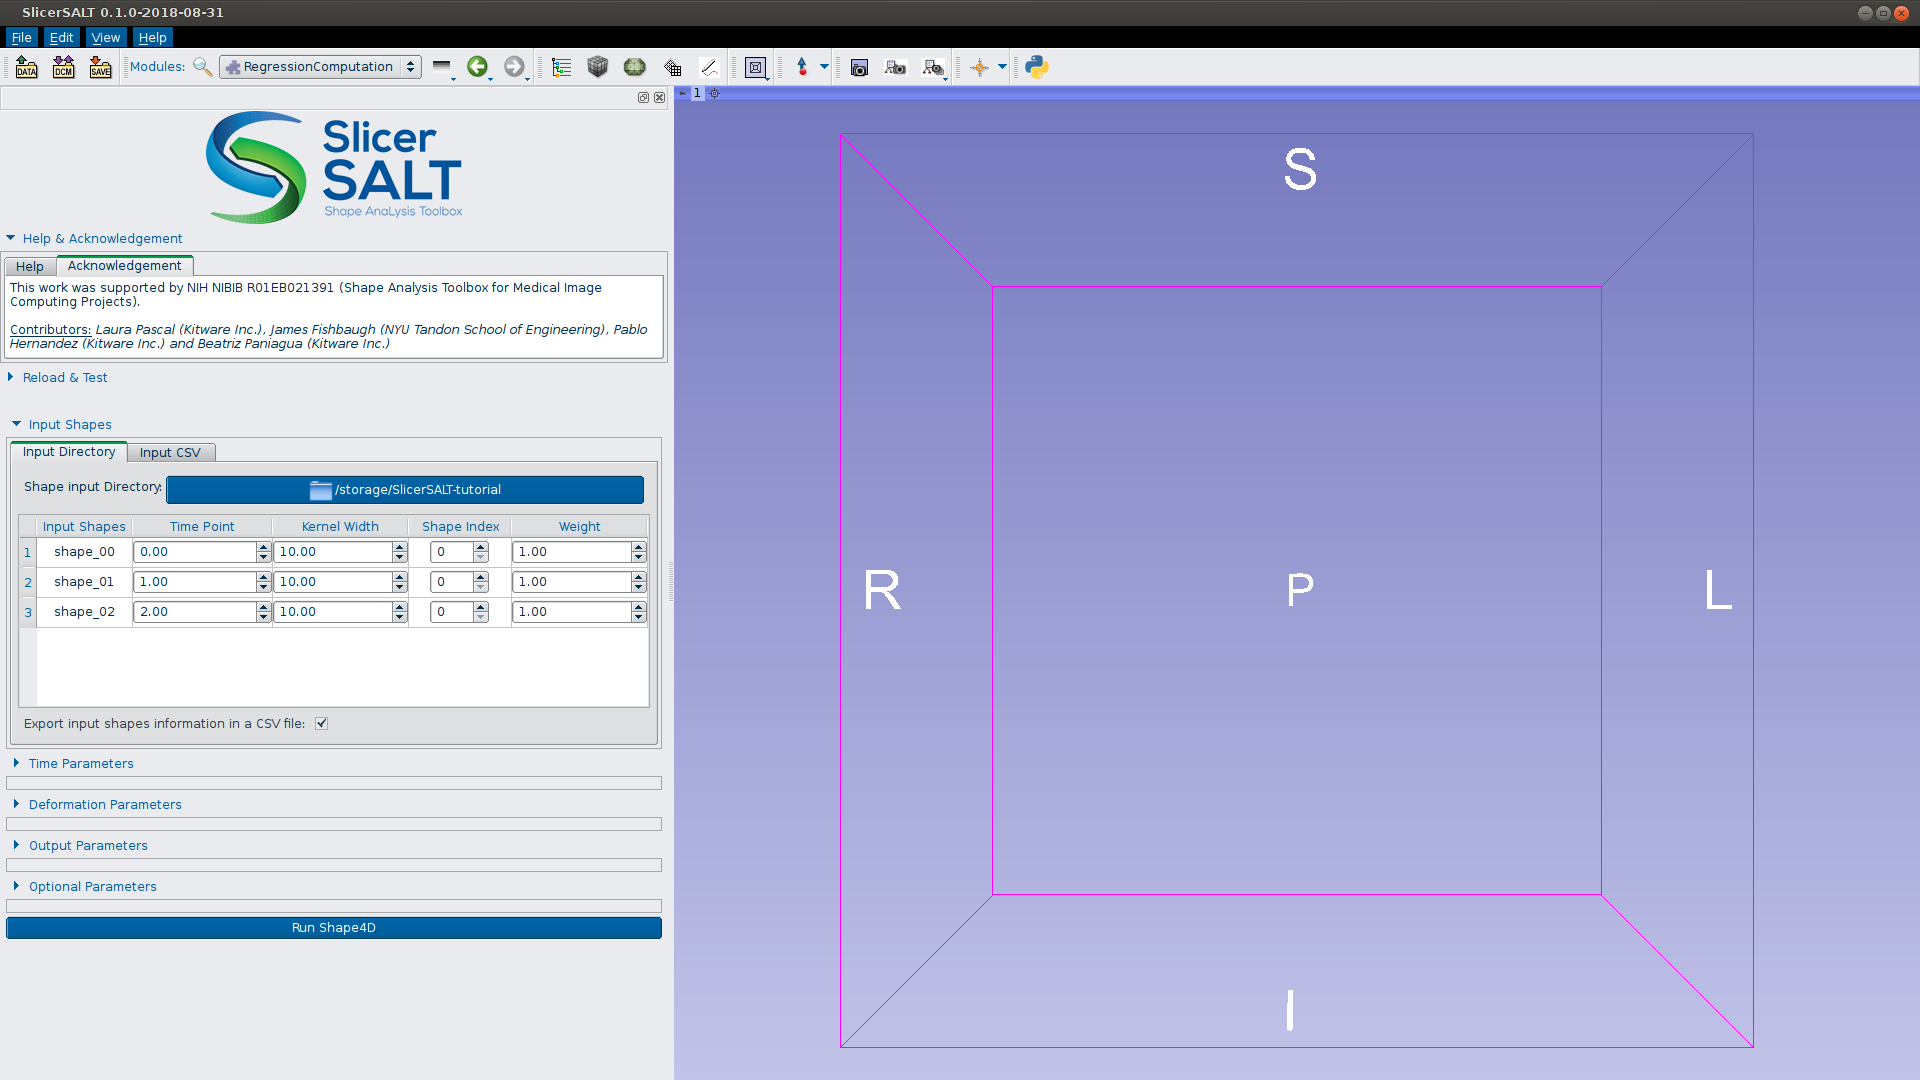
Time point range is set using the min and max from input shapes

Leave all settings at default and expand ‘Deformation Parameters’
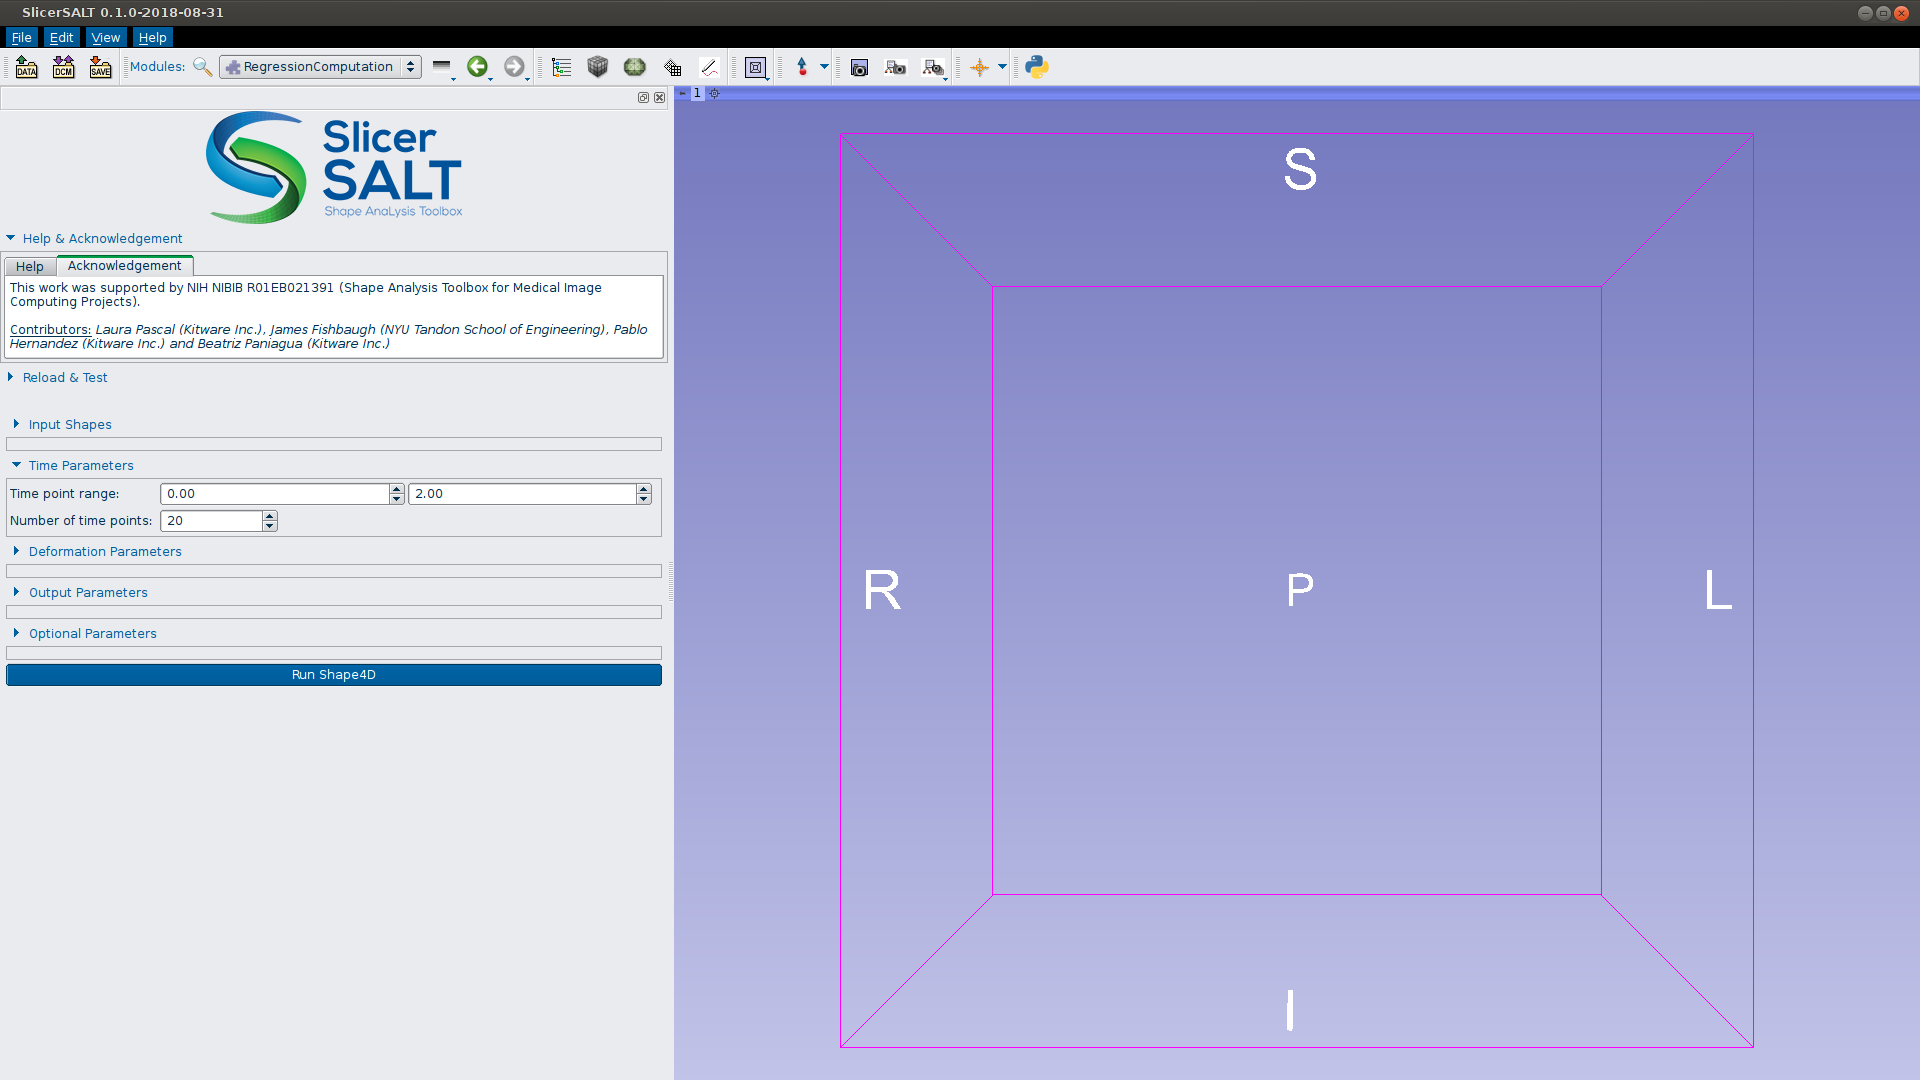
The width of the deformation kernel lowers values result in more non-linear changes, higher values tend towards rigid deformation.
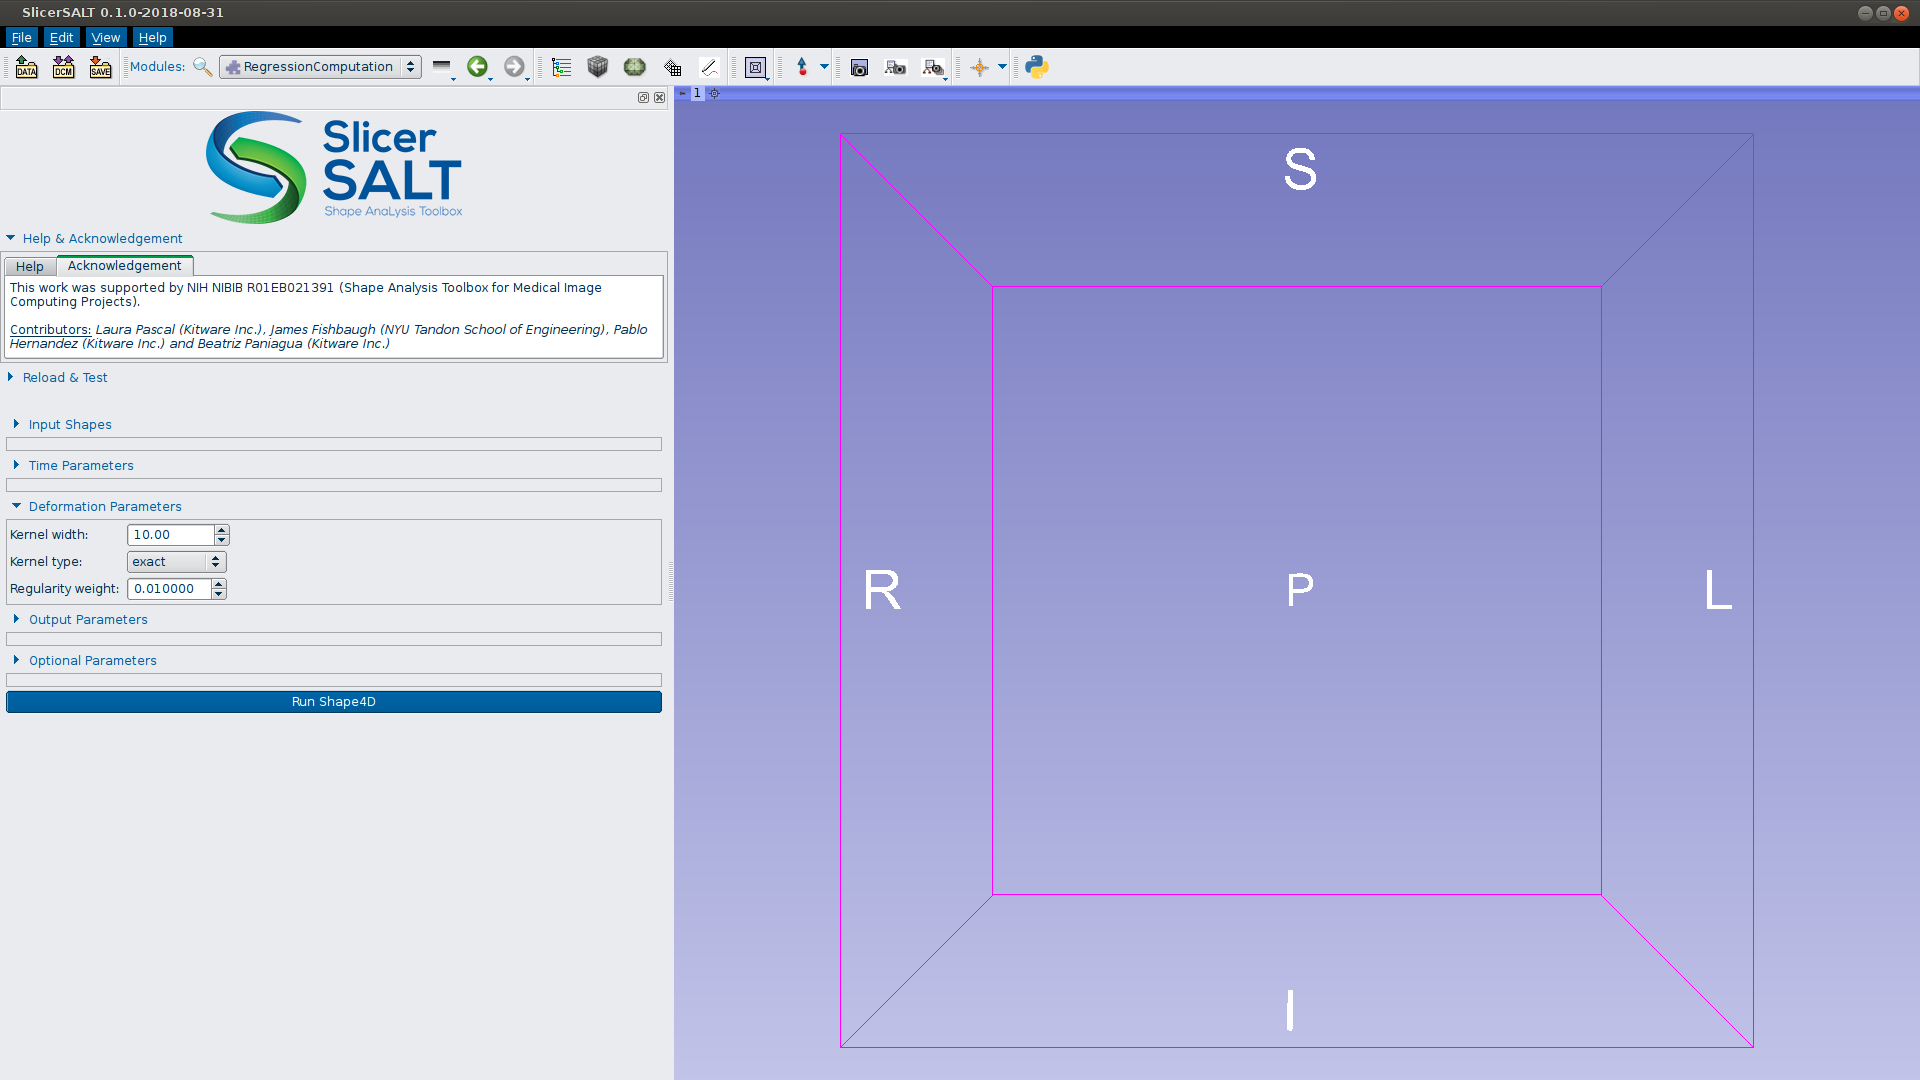
For shape inputs with only a few hundred vertices, chose ‘exact’, otherwise ‘p3m’ usualy results in faster model estimation.
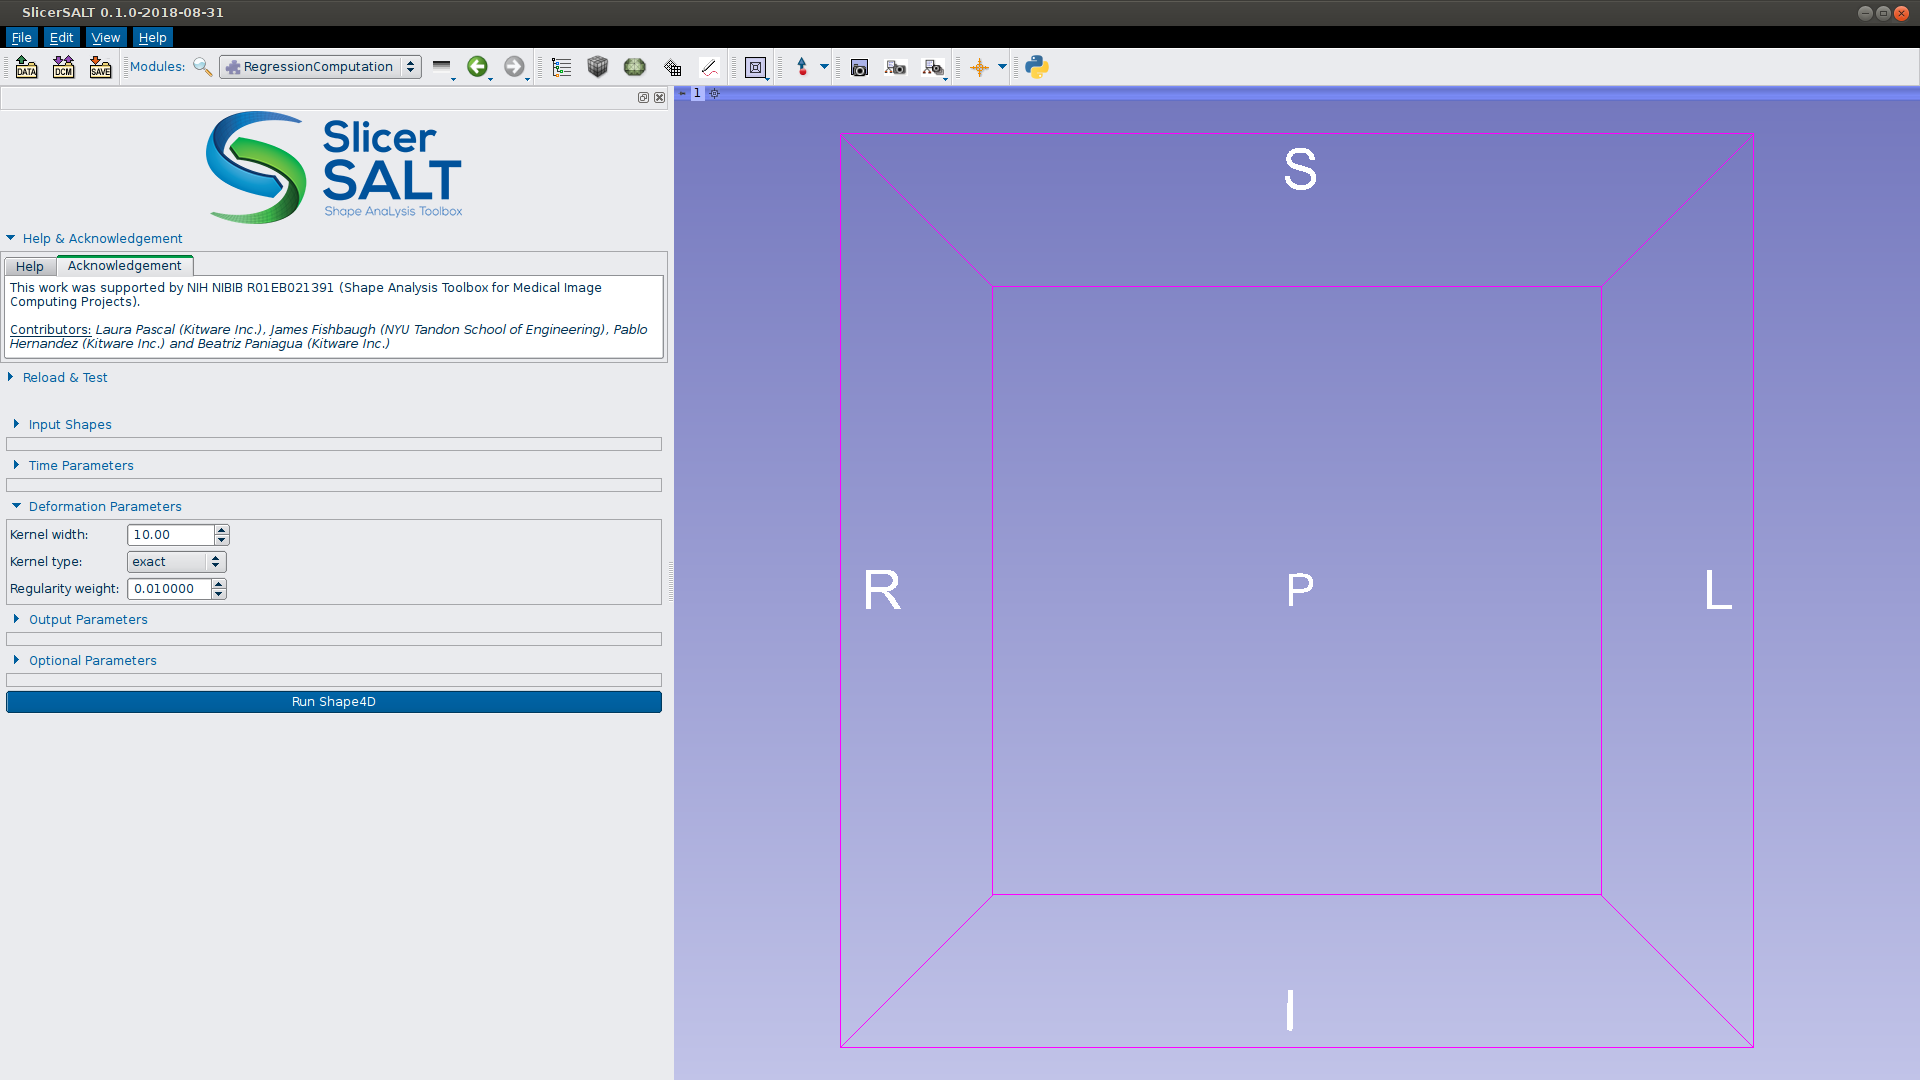
Regularity weight balances data-matching and regularity. Lower values favor accurate data-matching.

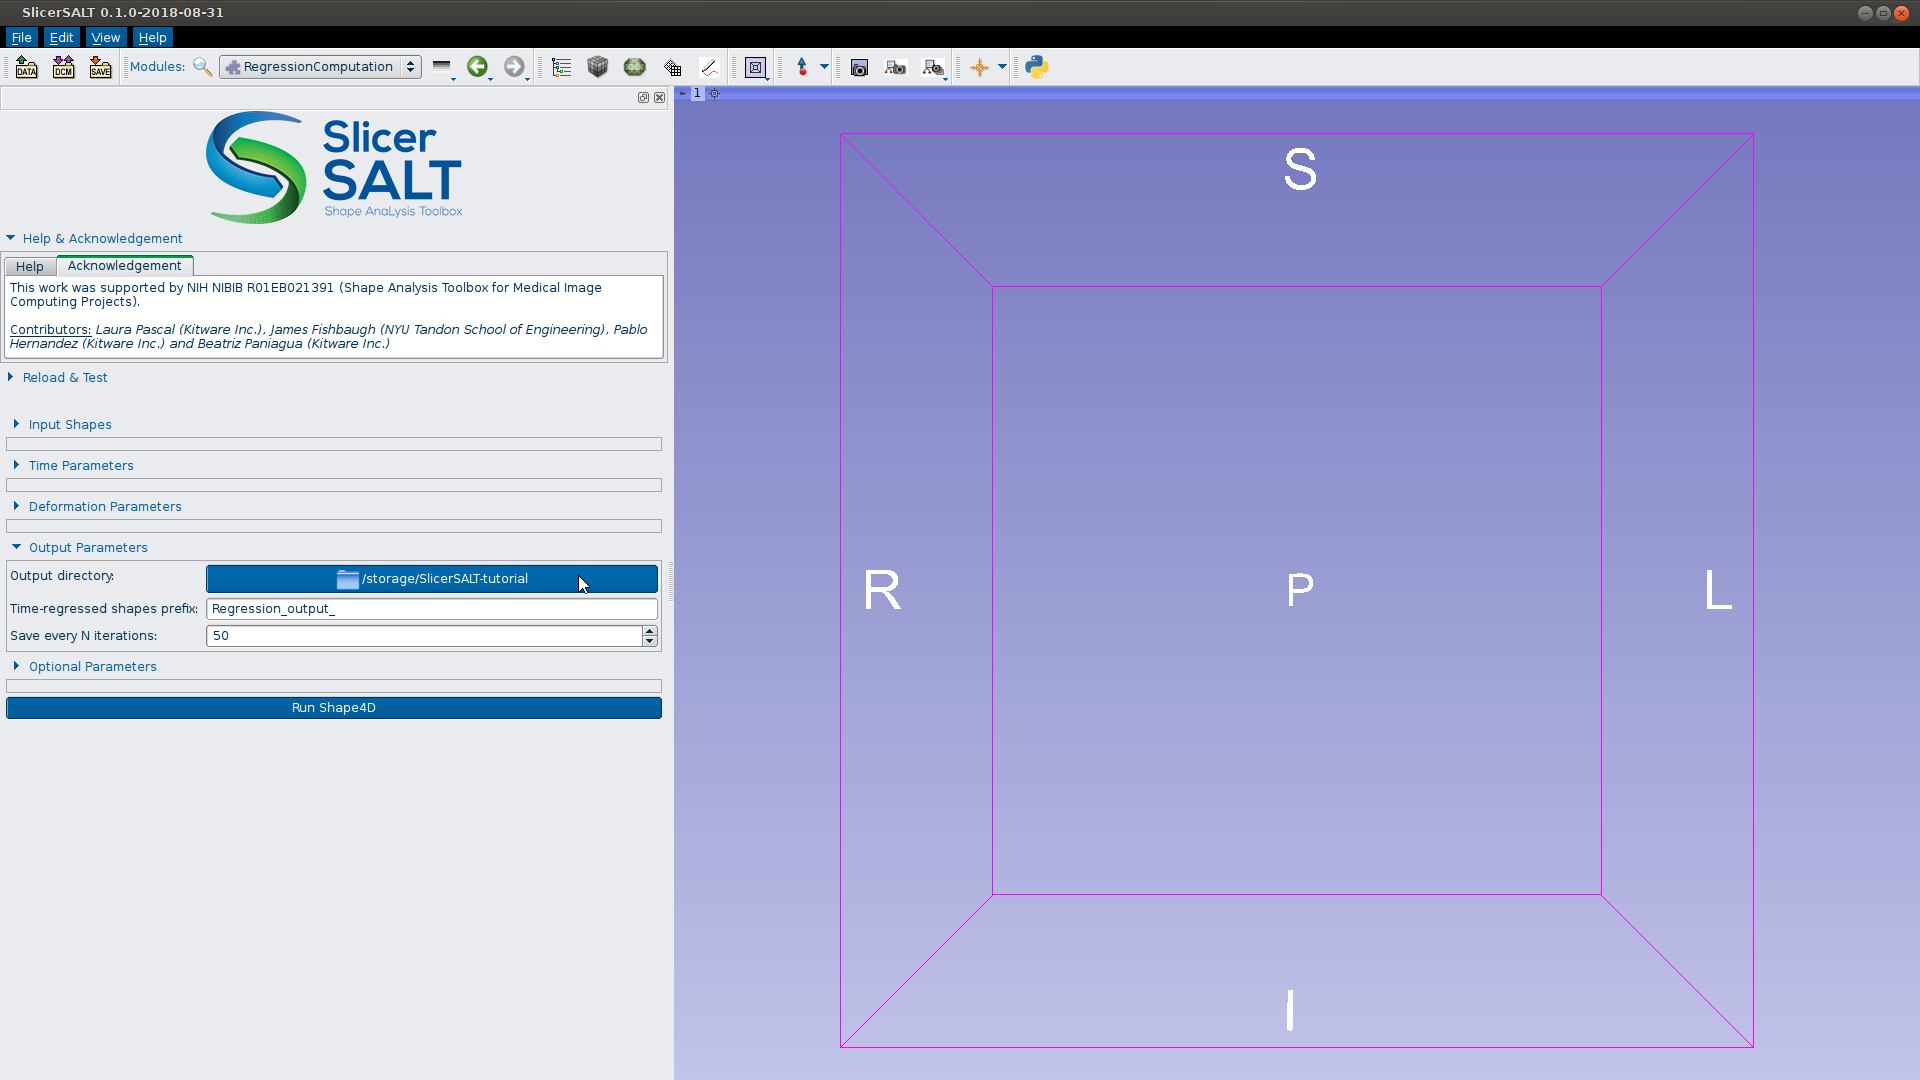
Leave all settings at default and expand ‘Output Parameters’

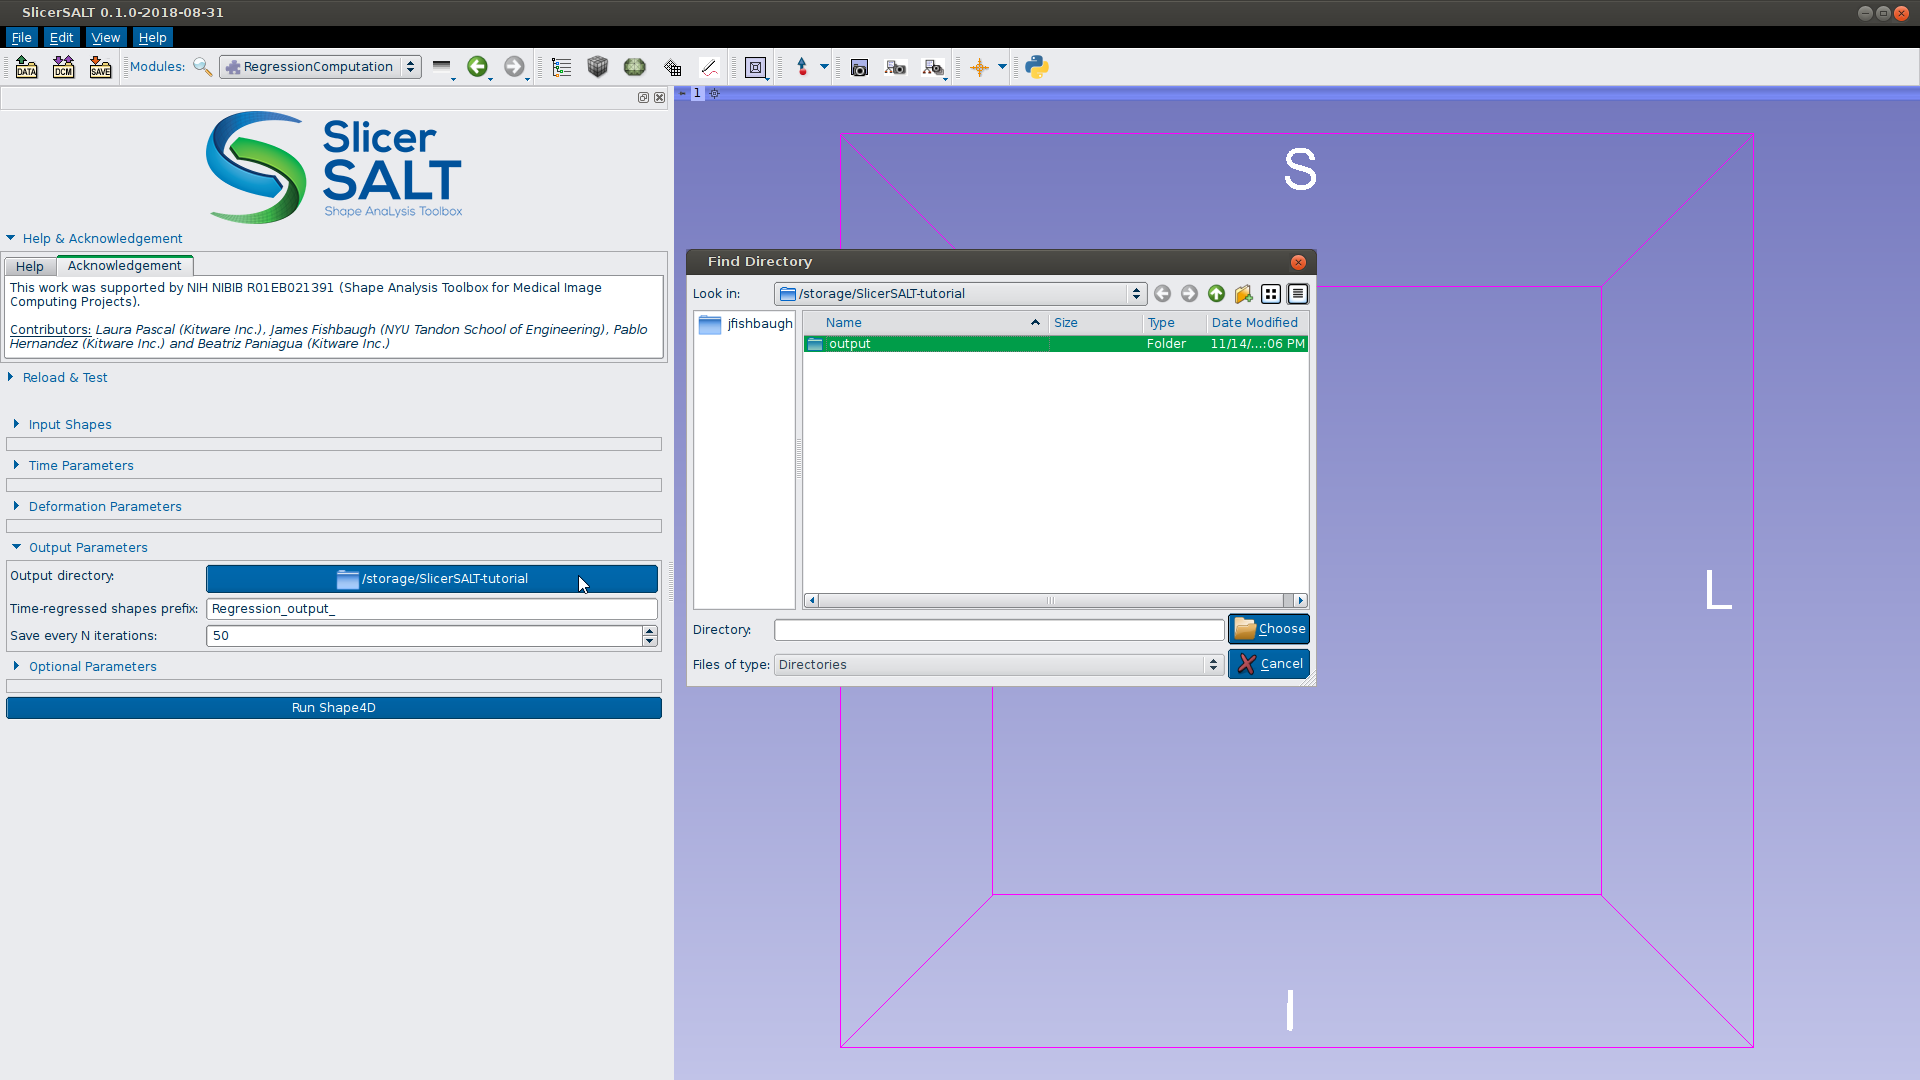
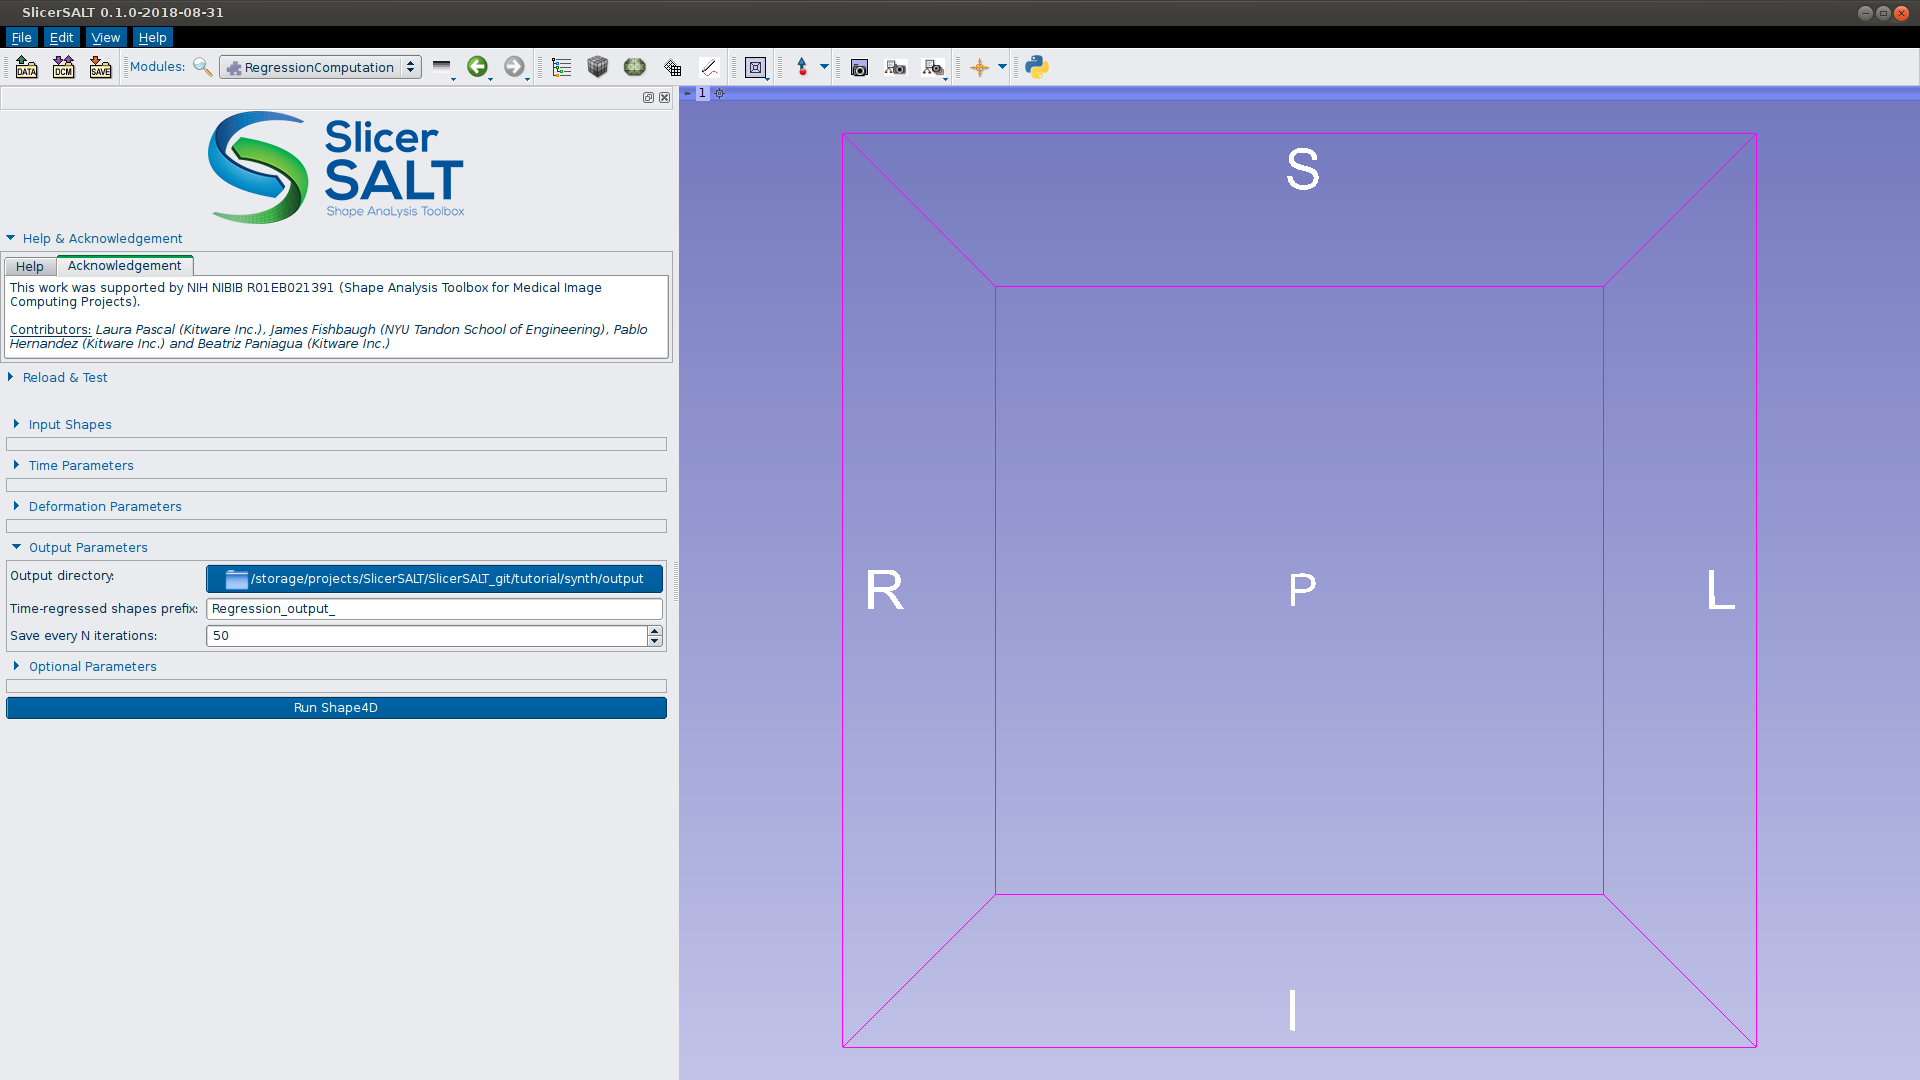
Click to choose an output directory for the estimated model
Create a new folder called ‘output’
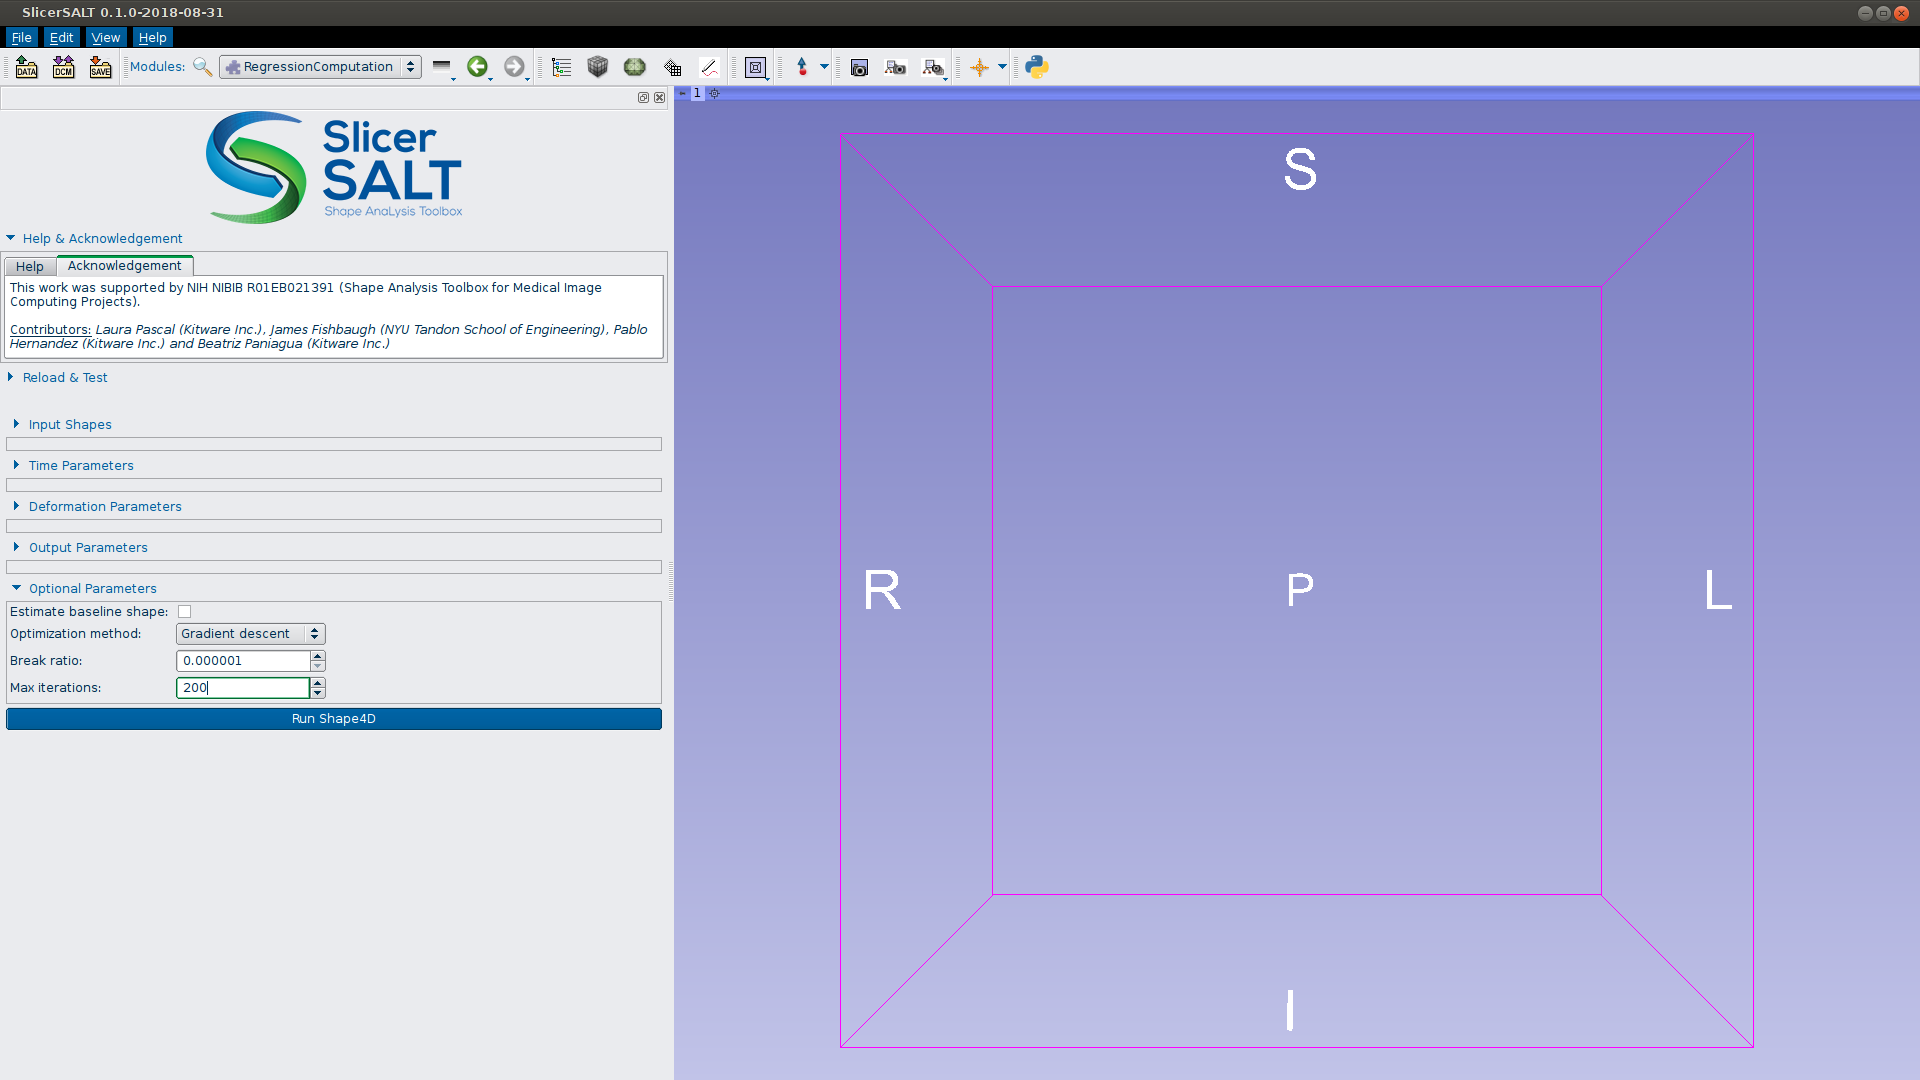
Leave all settings at default and expand ‘Optional Parameters’
Change the maximum number of iterations to ‘200’
Model Estimation
Click ‘Run Shape4D’
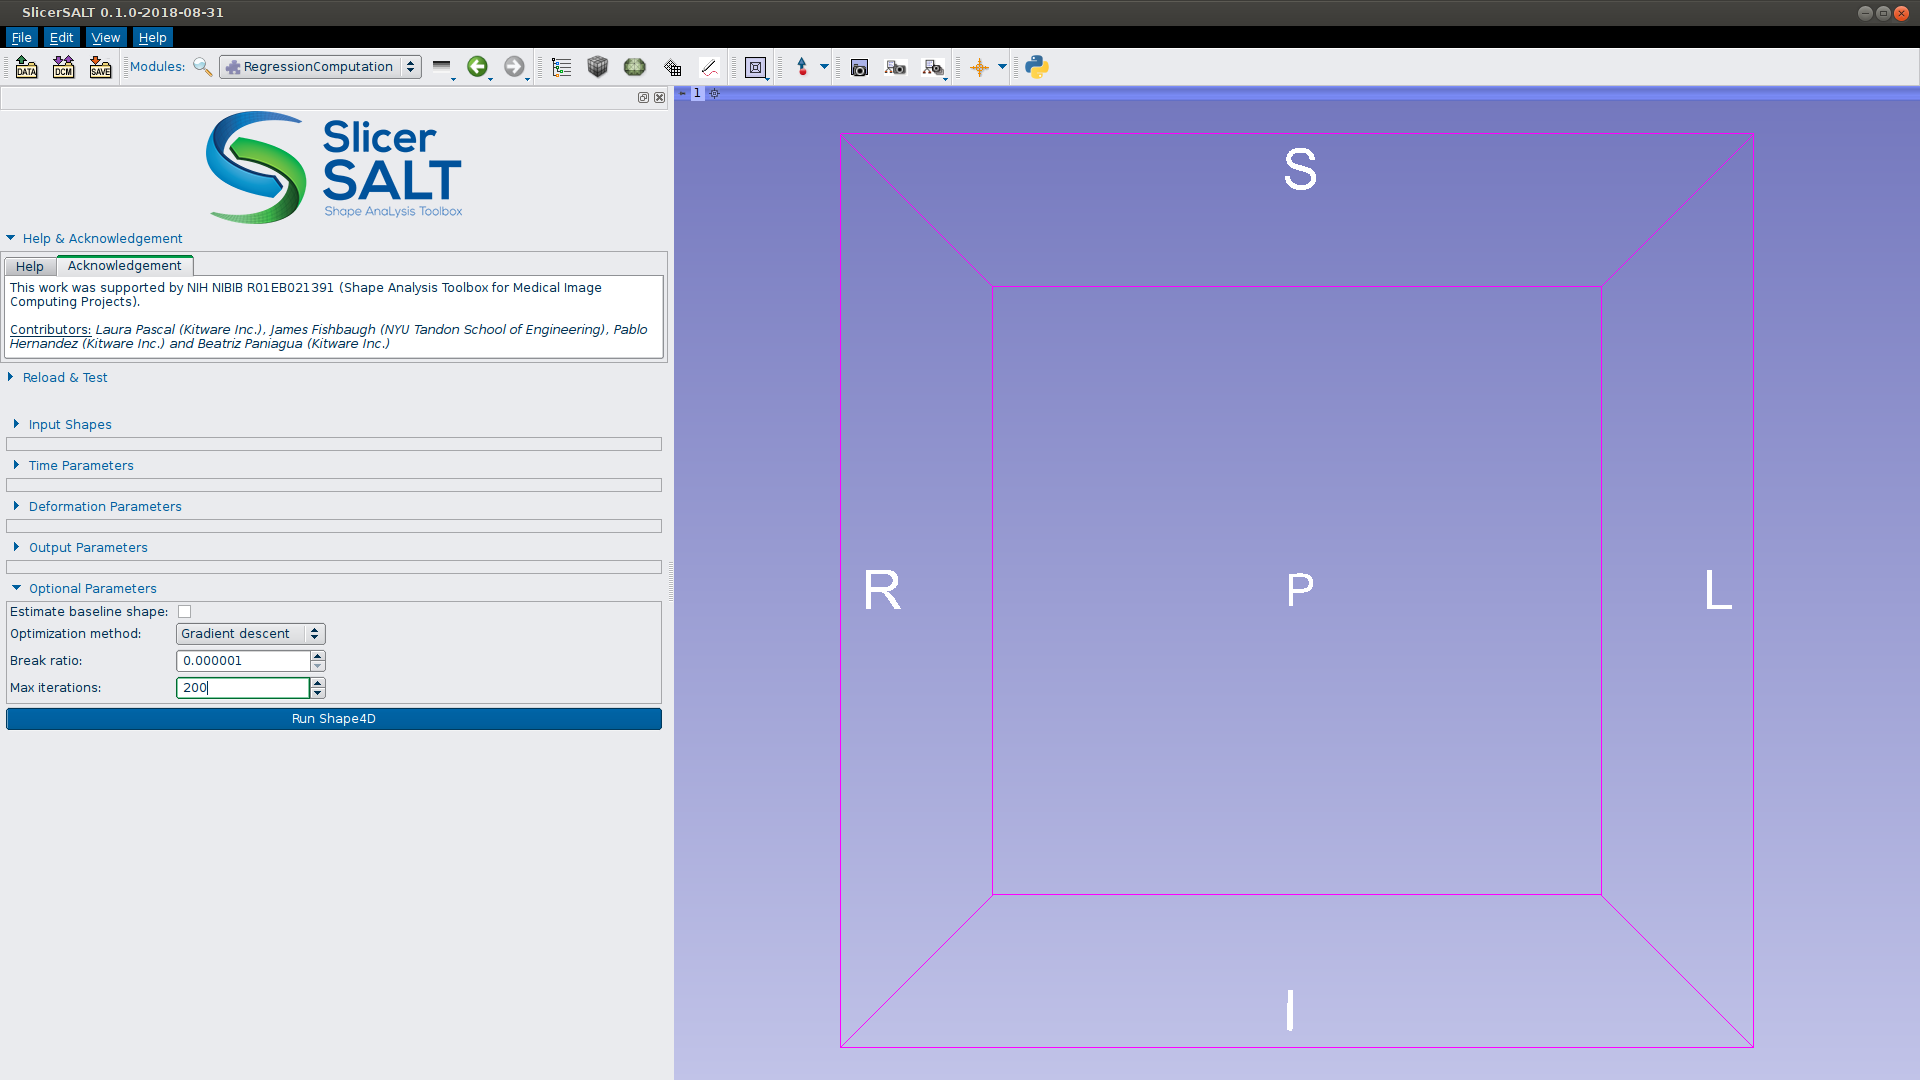
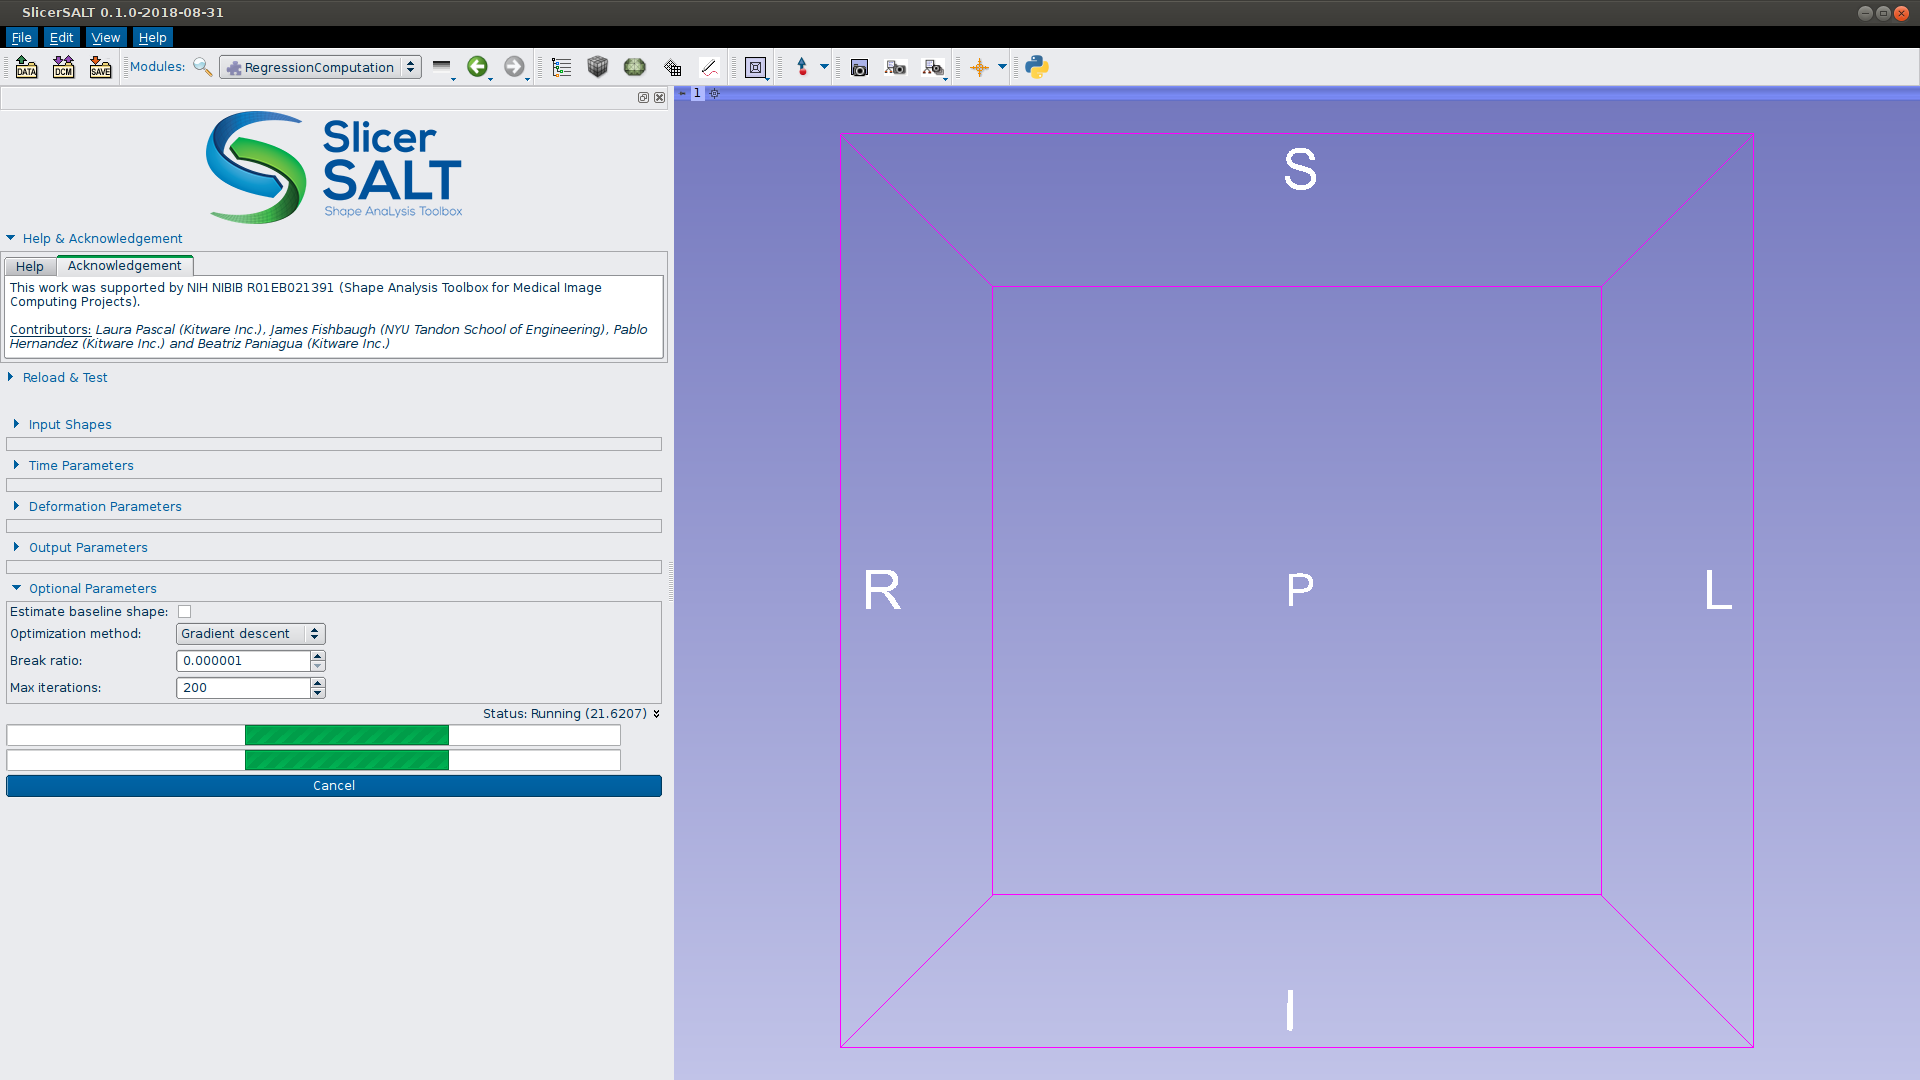
Estimation may take several minutes to finish
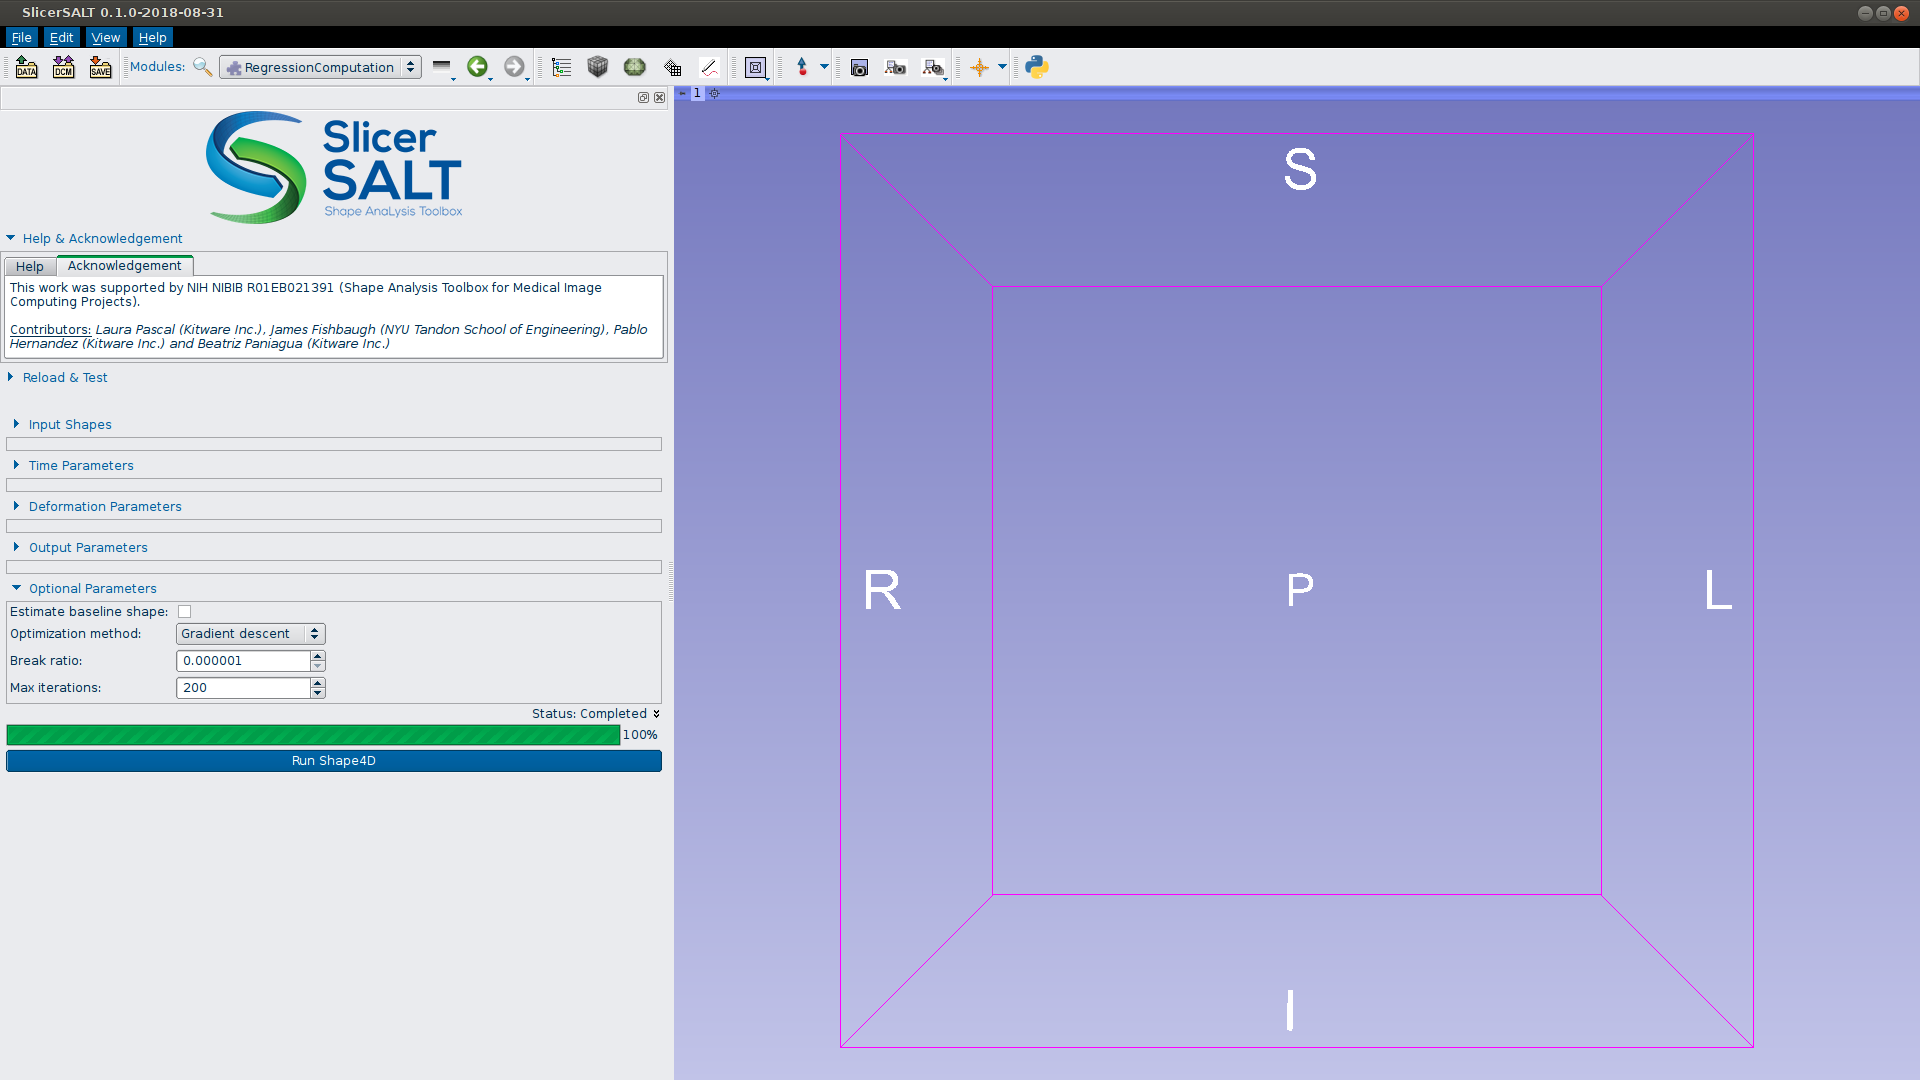
Estimation has converged when ‘Status: Completed’ is displayed
Visualizing Shape Regression Results
We can now visualize the model by selecting ‘ RegressionVisualization’
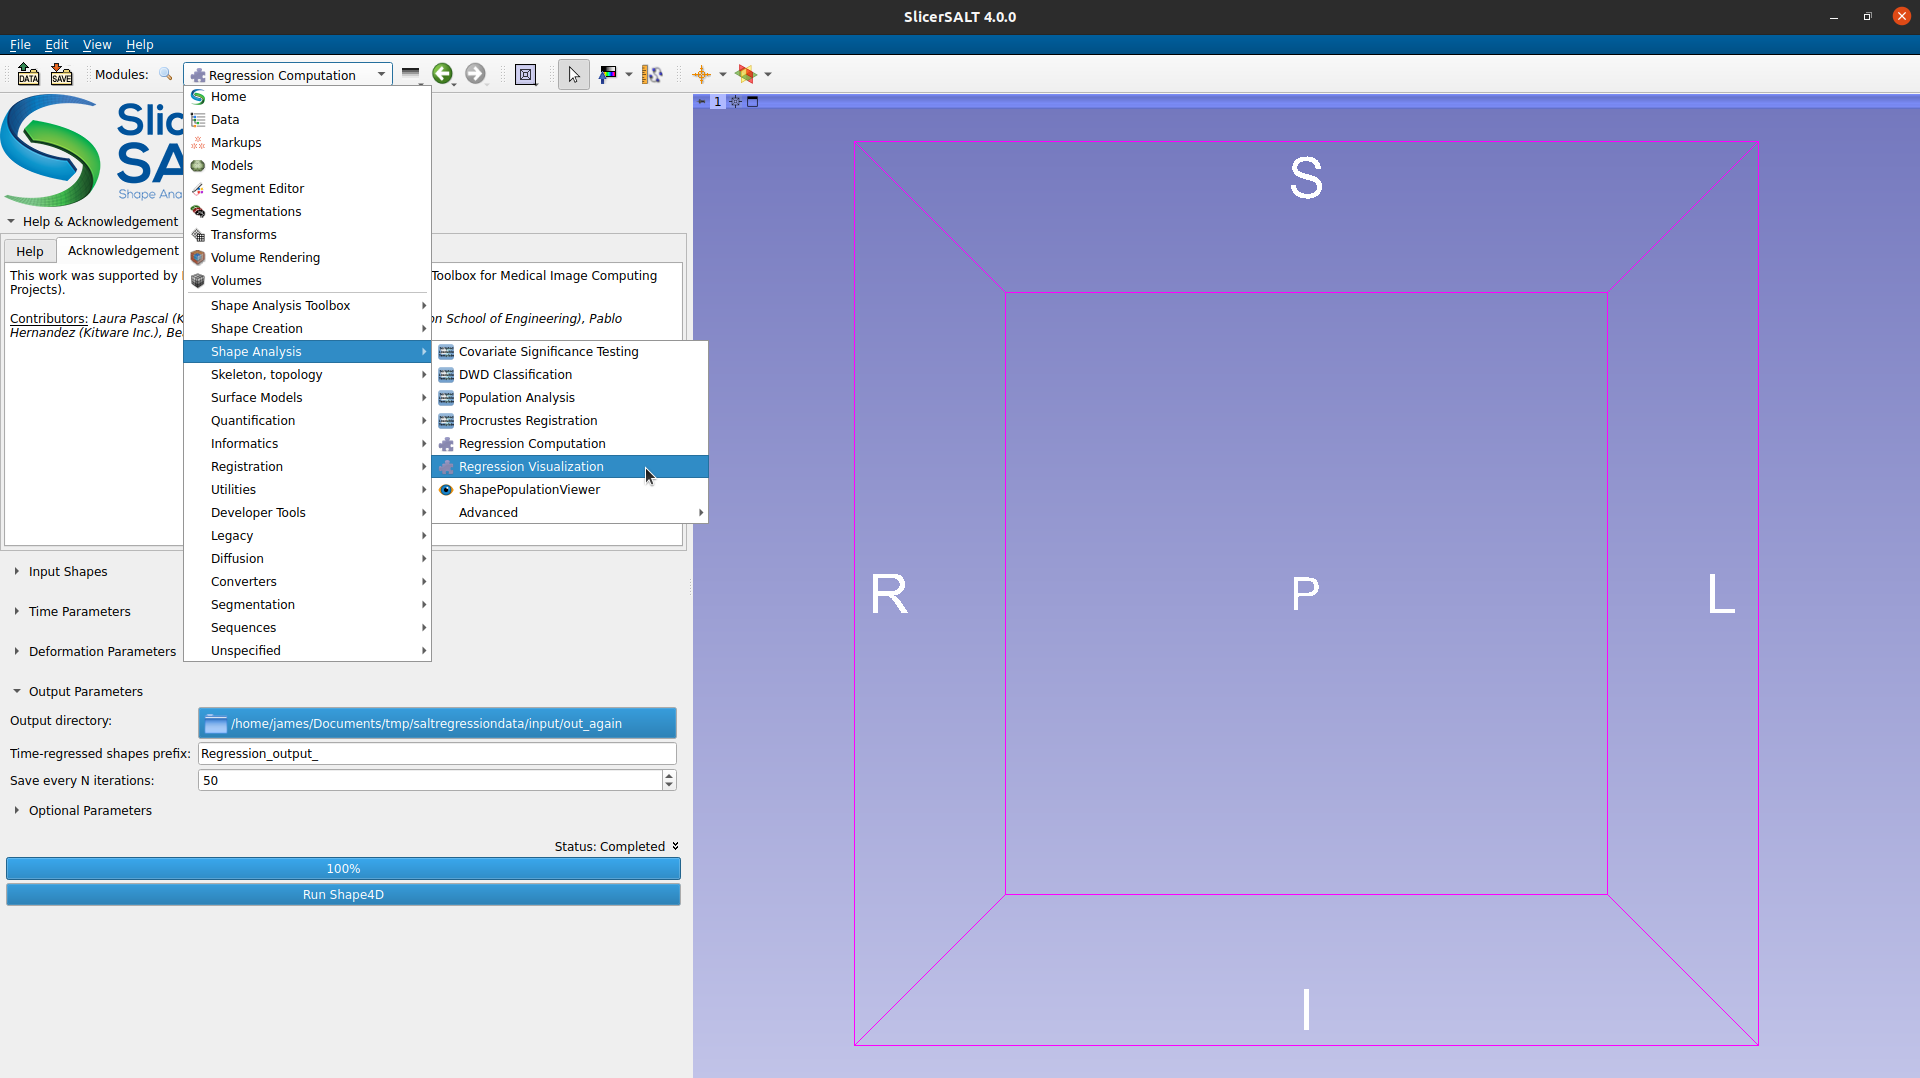
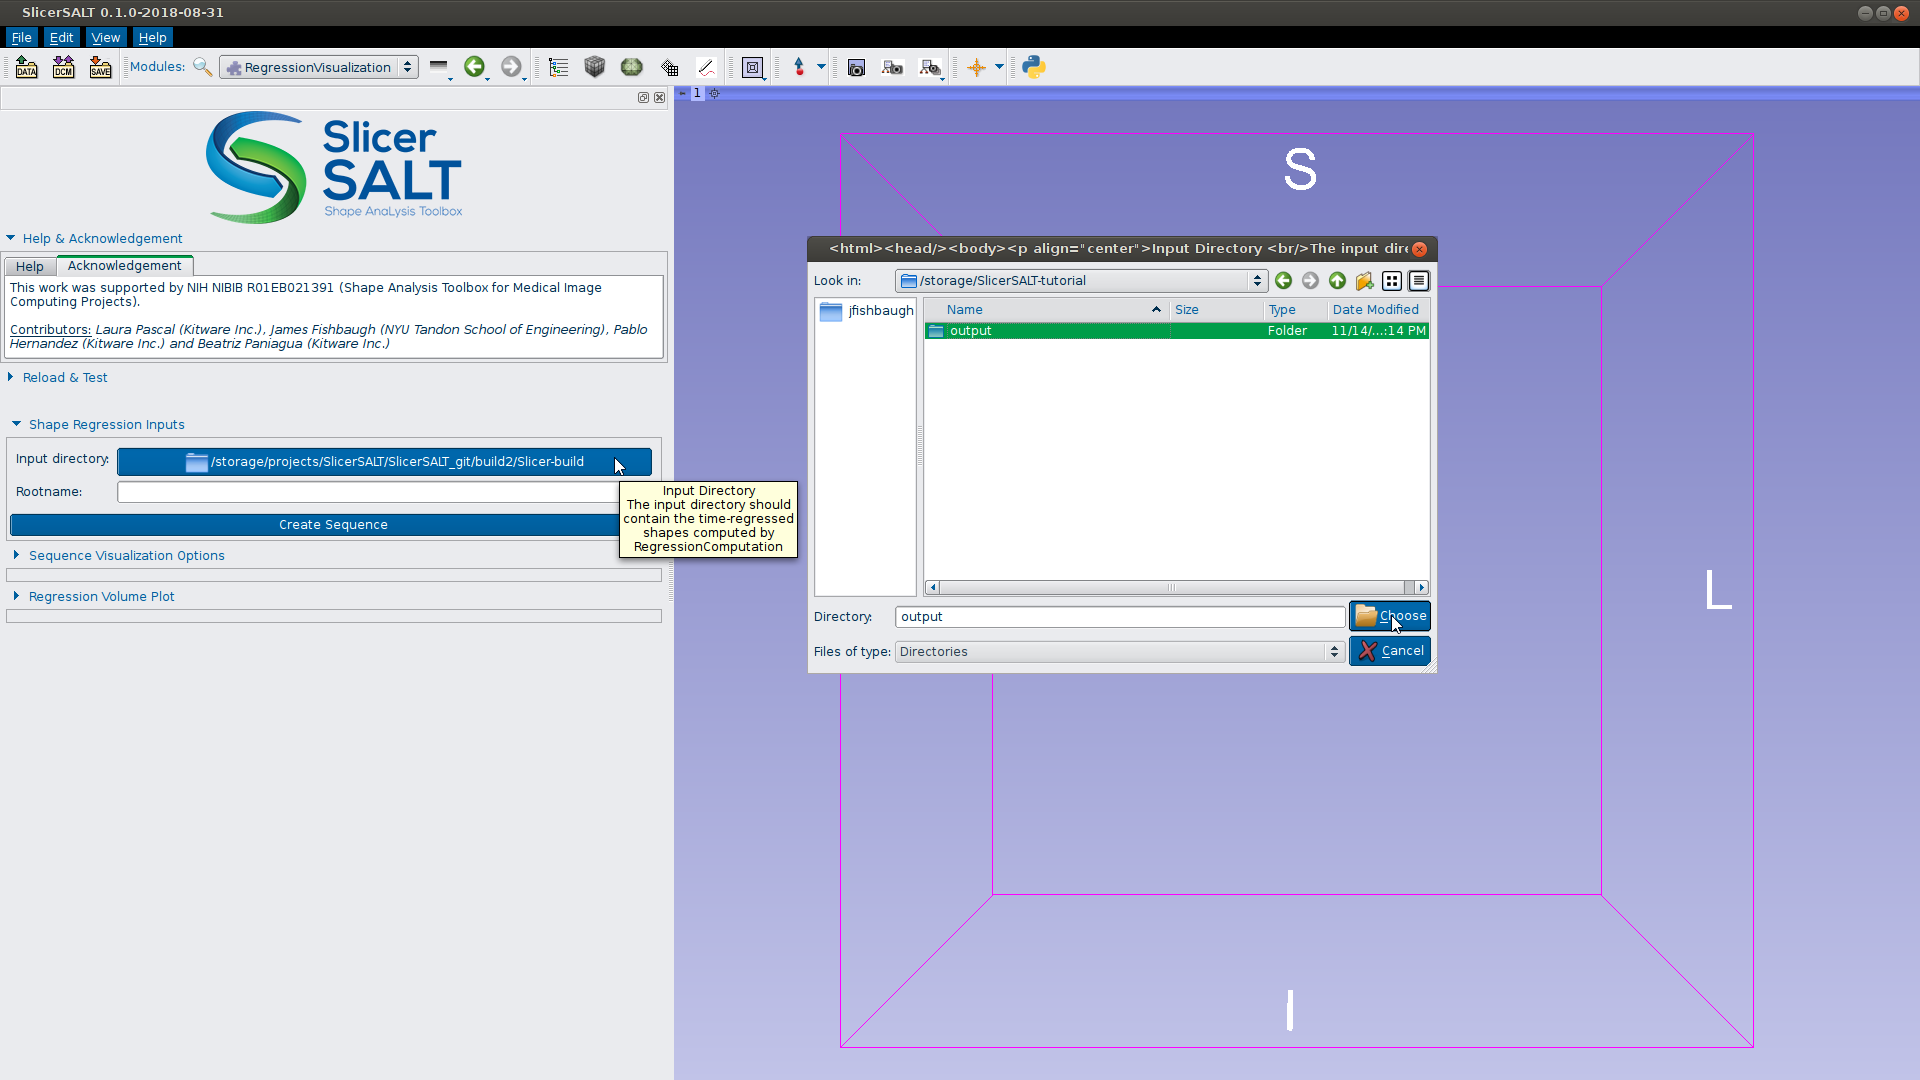
Click to choose the directory containing the estimated model
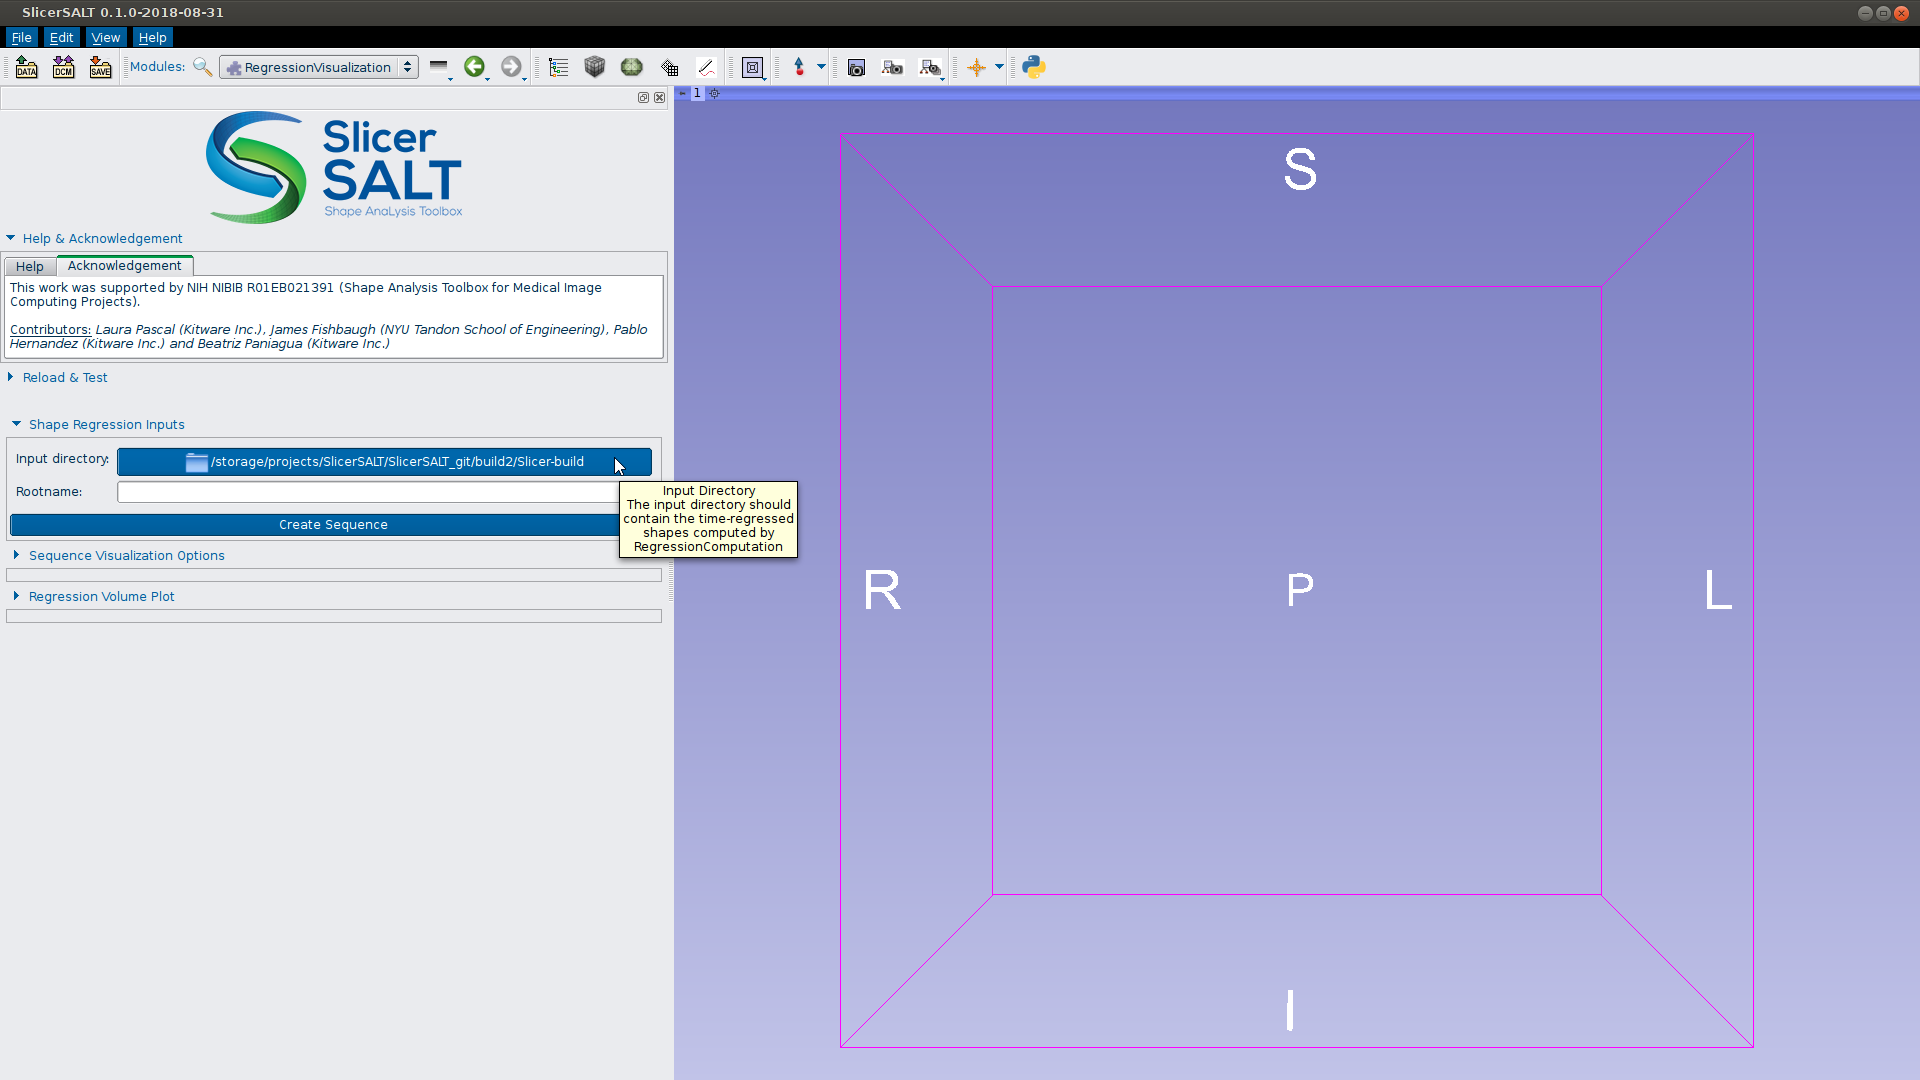
Choose the output directory from ‘ Regression Computation ’
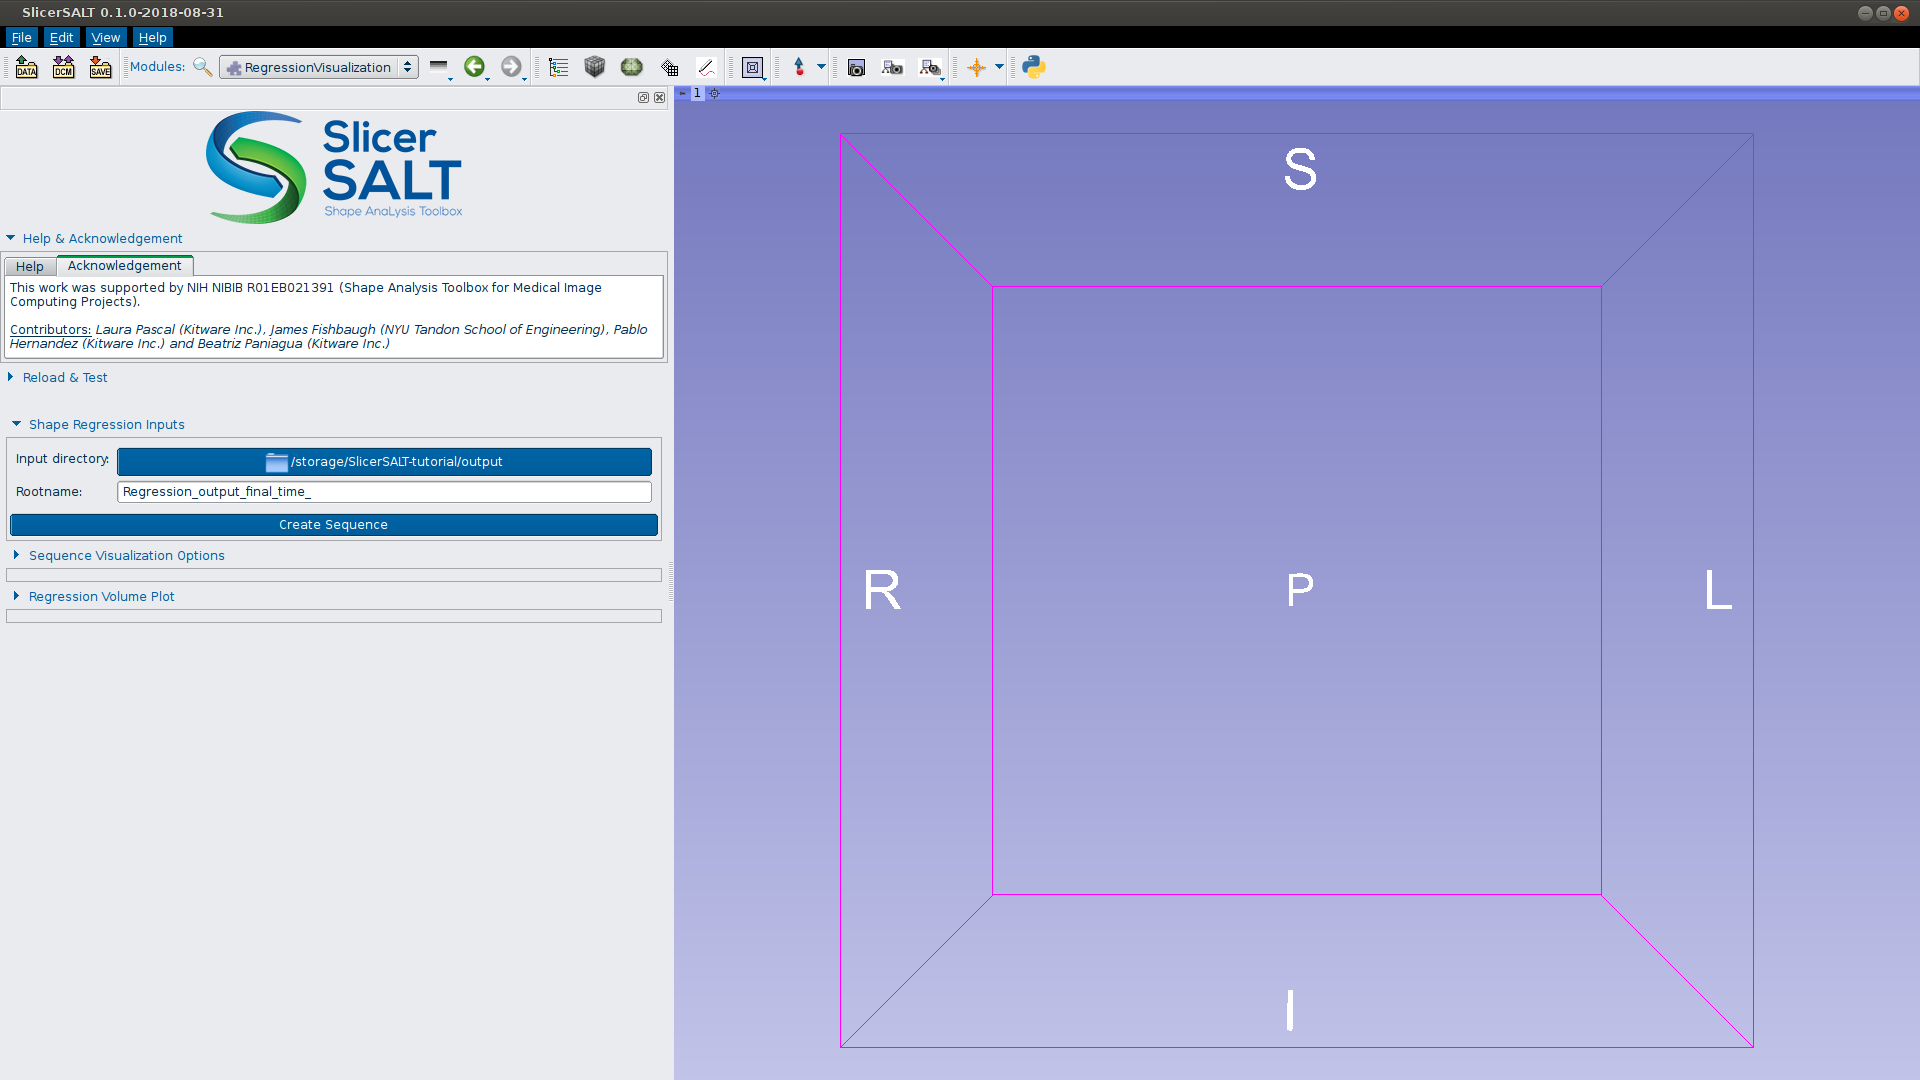
The rootname is automatically populated if a final model is found in the directory. Otherwise rootname has to be specified.

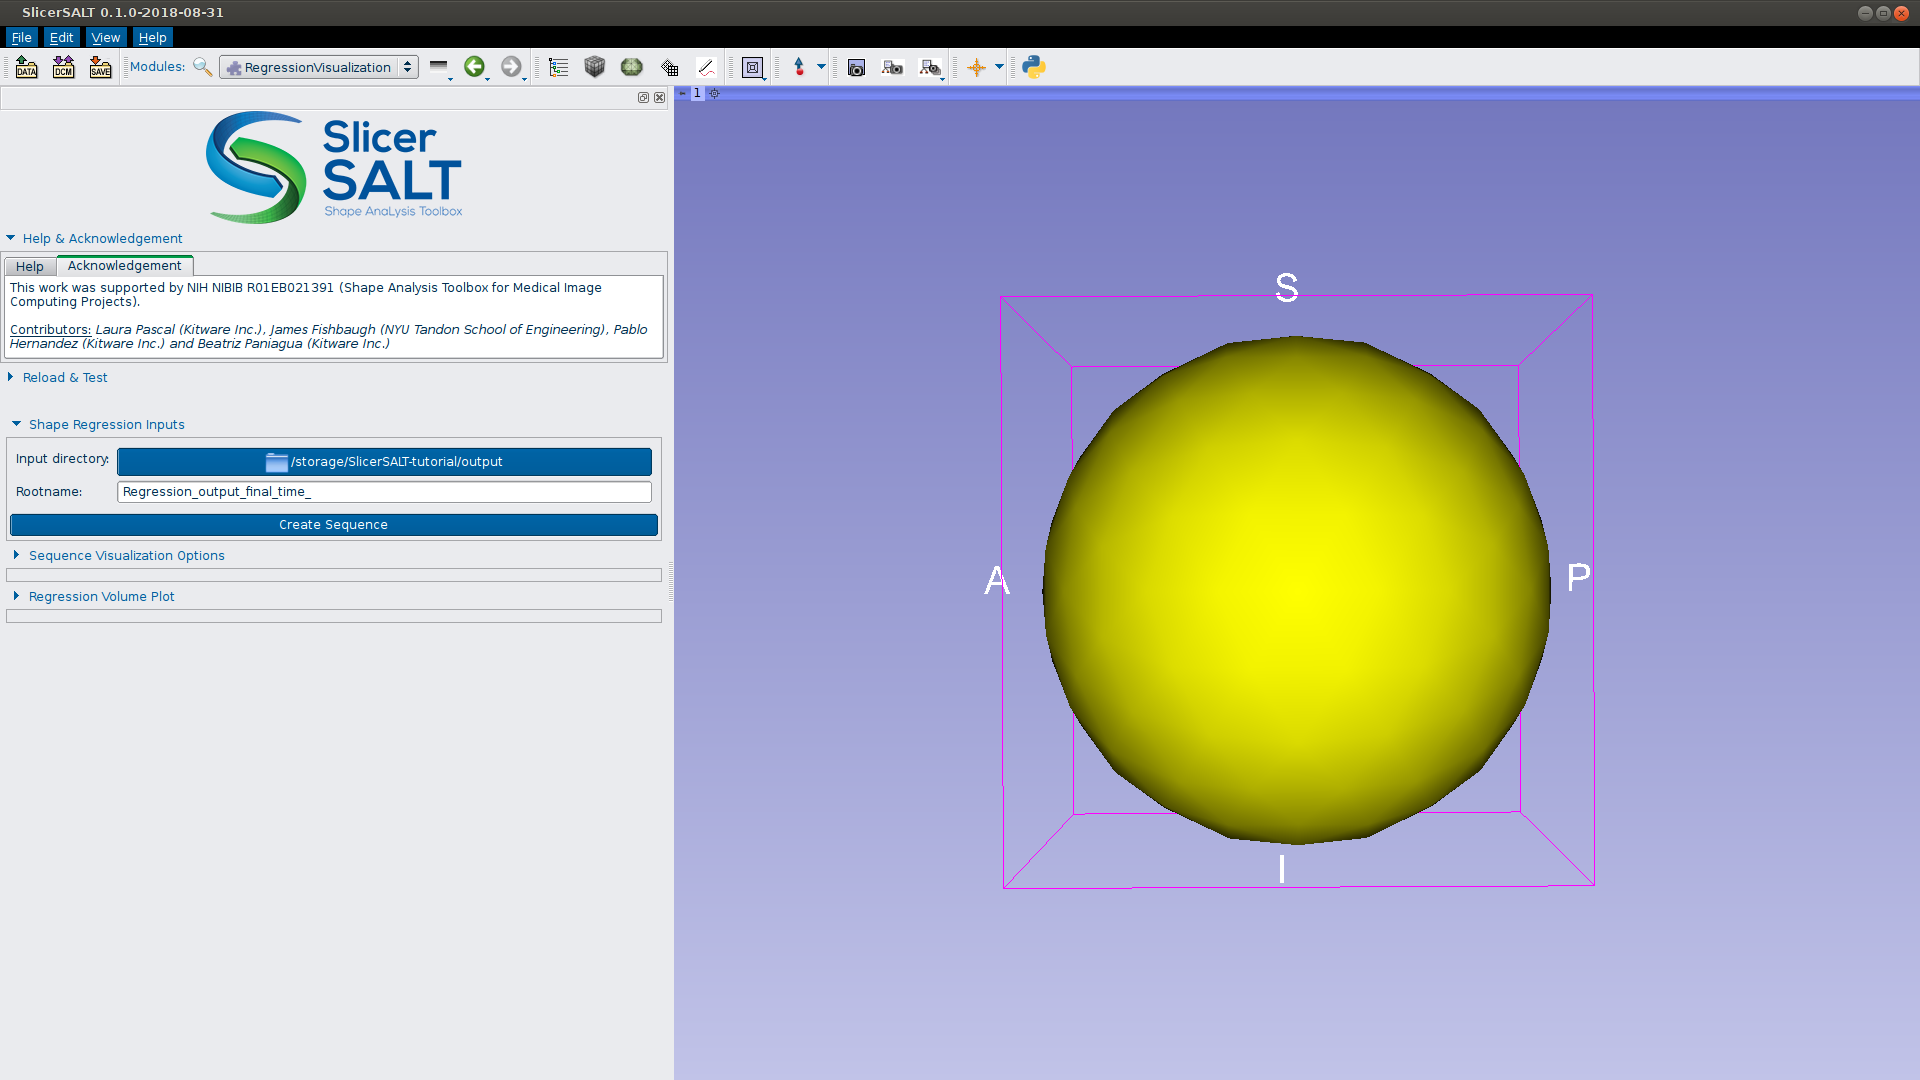
Click ‘ Create Sequence ’ button to load the model sequence
Hold right mouse button to zoom. Hold left button to rotate.
Expand ‘ Sequence Visualization Options’
Change the color map to _‘velocity’ _ to visualize speed of shape change

The ‘Sequence Browser’ section allows for playback of the model

Expand ‘Regression Volume Plot’ and click the plot button
A volume plot shows the estimated volume from shape regression along with the volume of the original shape observations

Shape Regression Debugging and Quality Control
If an error occurred, you will be presented with a notification. You can visualize error details in the Error Log under View

If RegressionComputation experiences an error, carefully check parameter settings, including:
Input shapes ‘Time Point’ - make sure all time points are within the ‘Time point range’
Check the input .vtk shapes exist at the path selected and verify all .vtk files are valid
In some cases, it may be necessary to reorient the surface normals of input shapes before model estimation
Use the RegressionVisualization module to view the estimated shape trajectory as an animation
It is helpful to load the original observations displayed with transparency to visually assess model fit

Use the RegressionVisualization module to view the volume measured after shape regression
The volume plot can help to assess model fit and inform about possible overfitting

Acknowledgements - Resources - Questions
- The ShapeRegressionExtension developers gratefully acknowledge funding for this project provided by NIH NIBIB R01EB021391 (Shape Analysis Toolbox for Medical Image Computing Projects), as well as the Slicer community.
- Github repository:
- Forums:
- Papers:
- Estimation of Smooth Growth Trajectories with Controlled Accelerationo from Time Series Shape Data.
- Model Selection for Spatiotemporal Modeling of Early Childhood Sub\-cortical Development
- For other remarks or questions, please email: beatriz.paniagua@kitware.com